Almost all physical processes of the business have moved to information systems that process information on leased/owned facilities in established corporate networks. This approach allowed to speed up the process of information processing and thus allowed the business to become more competitive. However, the system, due to errors in design and code writing, has its own vulnerabilities, which are exploited by intruders realising various kinds of threats. For example, after the leaks from large banks, forensics became involved in the investigation of the incidents.

Their arsenal contains not only a set of basic system utilities, but also powerful frameworks that can enable automated analytics and simplify work with massive data! In this tutorial, let's look at a case study of incident investigation through this framework.
Preparatory steps
First, let's install AutoPsy from the developer's official website or refer to the Windows package manager:
winget install SleuthKit.Autopsy 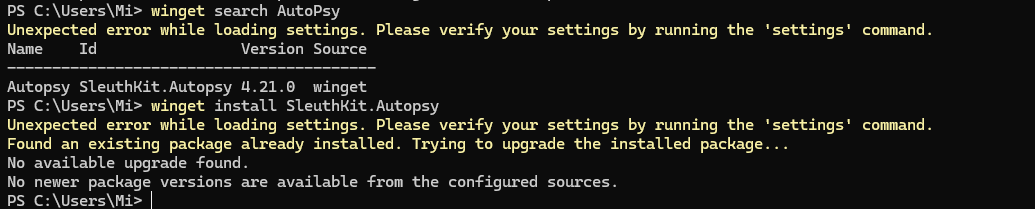
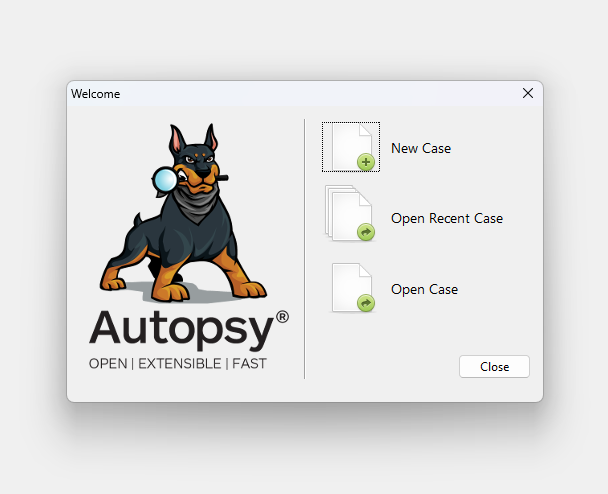
After that we can go to the main window, where we are greeted by a menu with projects. Let's choose to create a new one and specify the source from which we will connect our data:
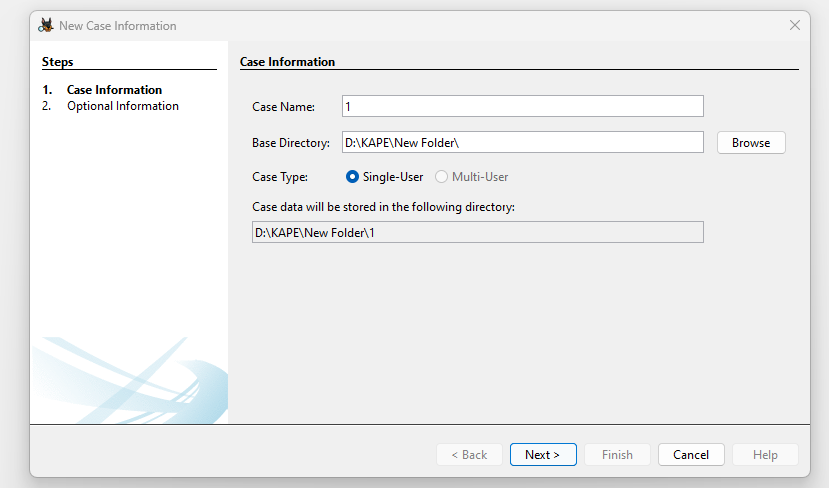
Let's create a new project about the incident, where we set the directory where our data is stored and its name:
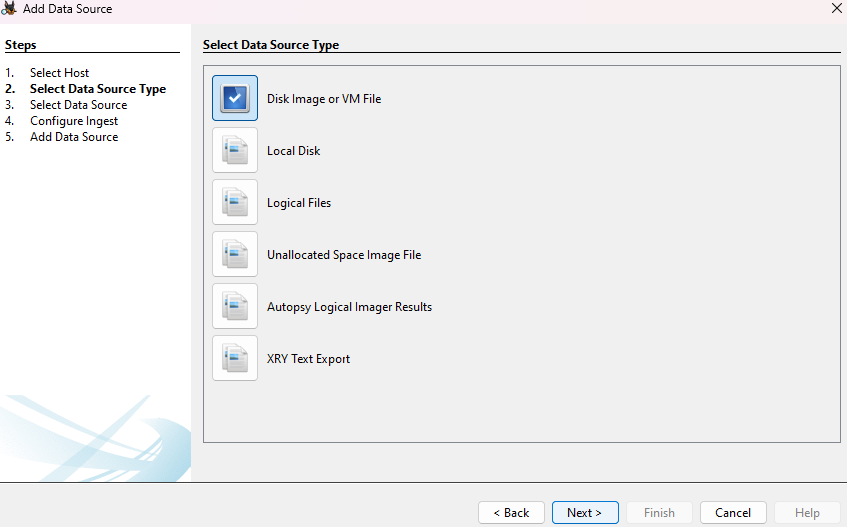
After an empty database will be created for the incident where the artefacts and entities will be stored, select the data source:
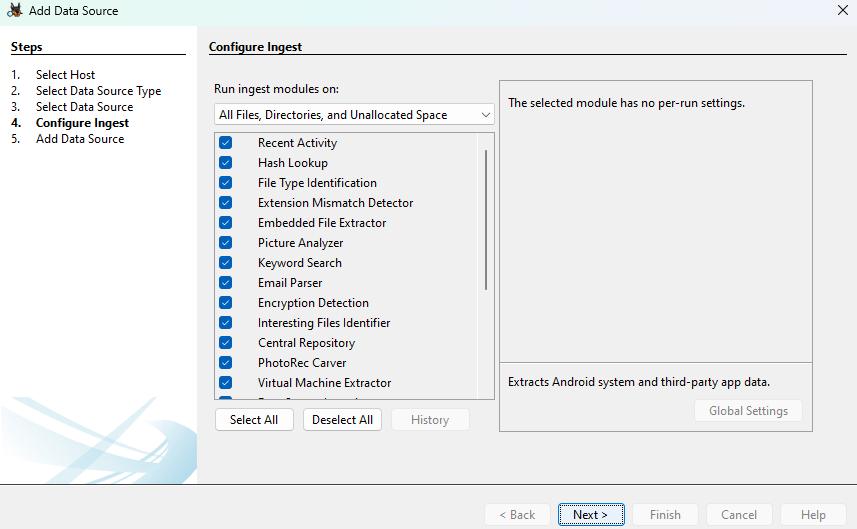
And also select the main modules that will perform your disc analytics:
After AutoPsy will start to analyse the provided data, as well as taxonomise it, which can take a considerable amount of time!
Investigation
In order to perform an investigation, it is necessary to follow the concept that among the array of analysed data from a non-volatile storage device. We need to find IOC entities, artefacts from their procedures, tools: virus hash, malicious IP/Domain/URL, registry entries, logs and network traffic. Let's go to the disc and look at its metadata:
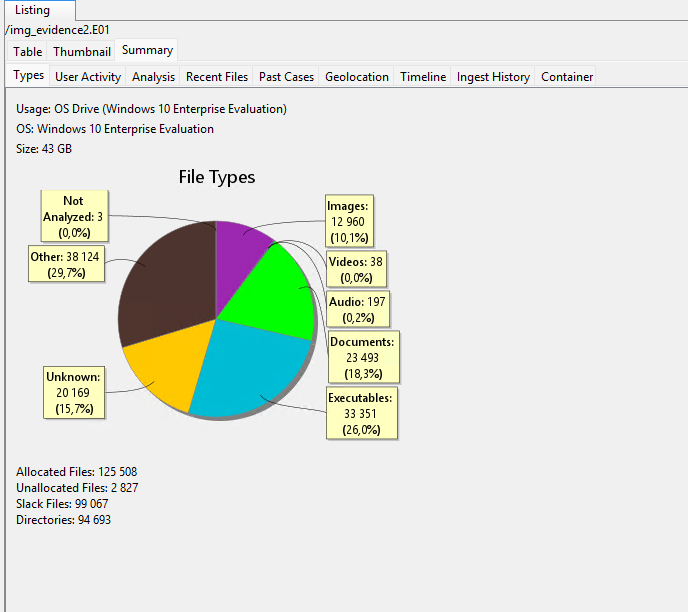
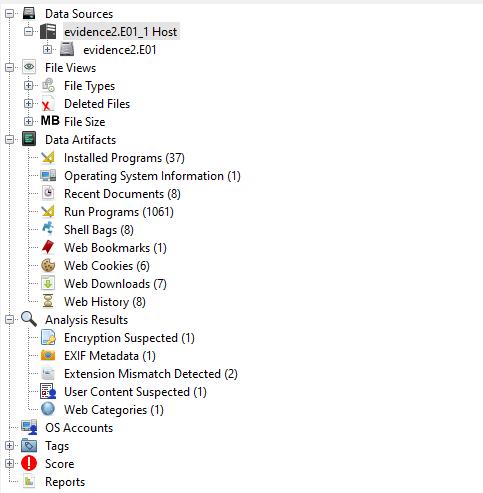
Here we can see a brief summary of the information from the drive, which gives a partial understanding of its composition by file. On the left is the full menu regarding which the disc was parsed. Key elements and sensitive directories were found by patterns using regular expressions.
It is important to understand that this tool, although it has various modules, it is mainly concerned with parsing and taxonomisation, i.e. collecting Triage, but not with analytics! Which means that data analysis in this tool will need to be done manually. First of all, we need to find an artefact or attribute of the attack that was carried out!
For example, let's check the logs of the PS interpreter to see what actions could have been performed in the attack. To do this, we can look through the files on the path C:\Users\AppData\Roaming\Microsoft\Windows\PowerShell\PSReadeadeady, pay attention to C:\Windows\System32\WDI, where process trace logs are stored, or to the classic EventLog C:\Windows\System32\winevt\Logs. In our case study, we found suspicious activity in the form of executed commands in the interpreter:
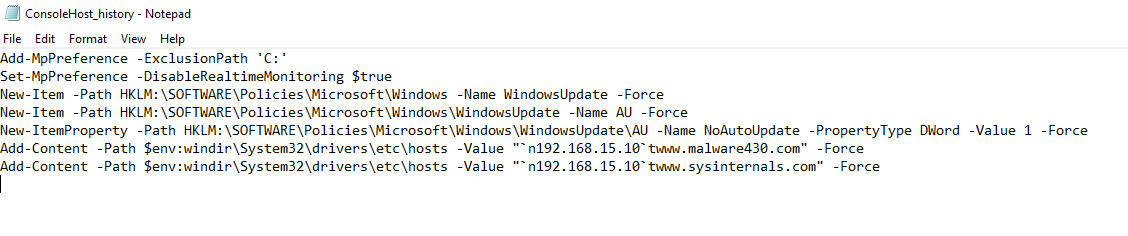
There are already a lot of key entities/artefacts here, from which you can find interconnections with other viruses, tool actors, sequentially uncovering the chain. For example, we can see that DNS records were spoofed and now instead of a resource on the Internet, the user will turn to a machine in the local network. Let's find artefacts in the form of network requests and other actions with the resource, for this purpose let's enter the domain into AutoPsy search:
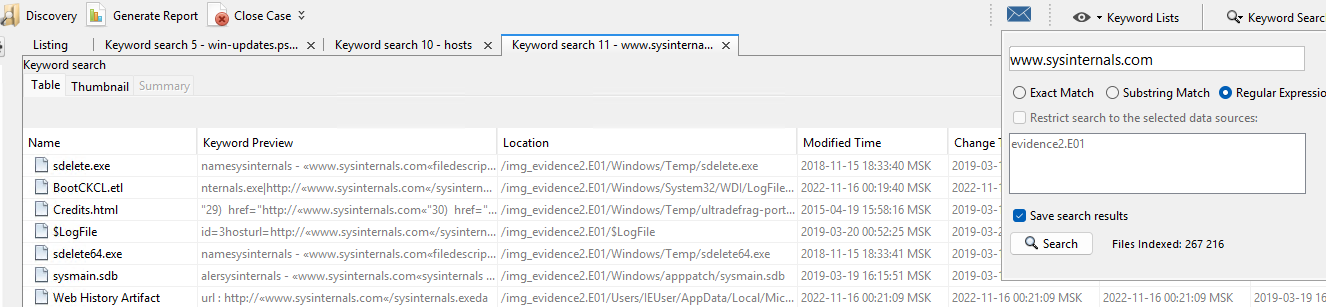
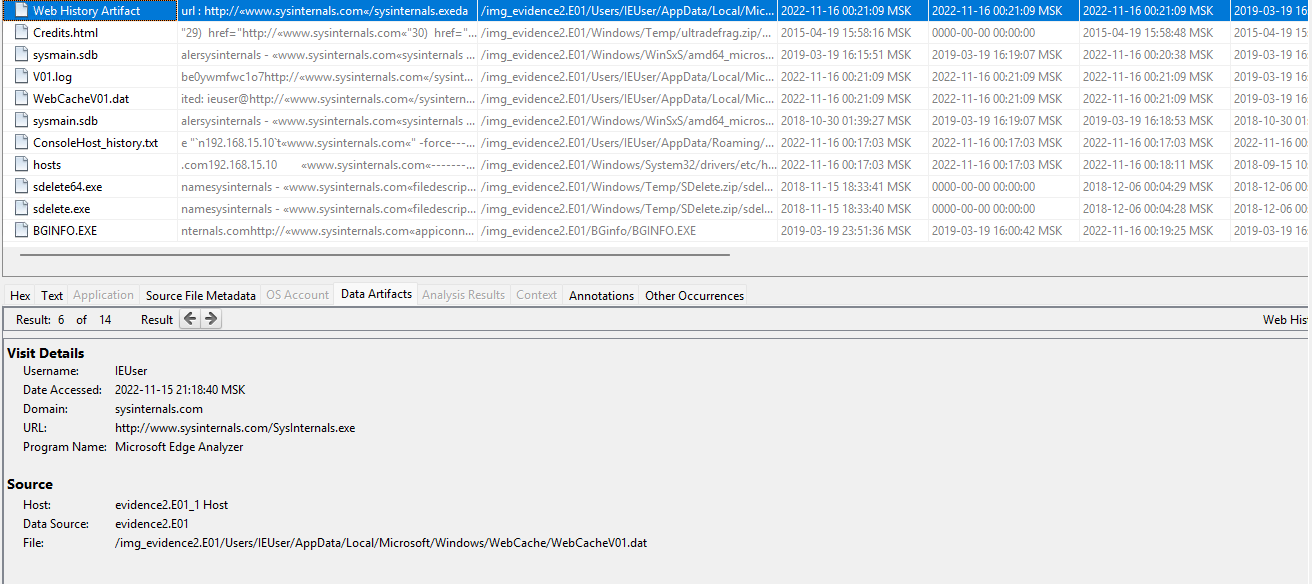
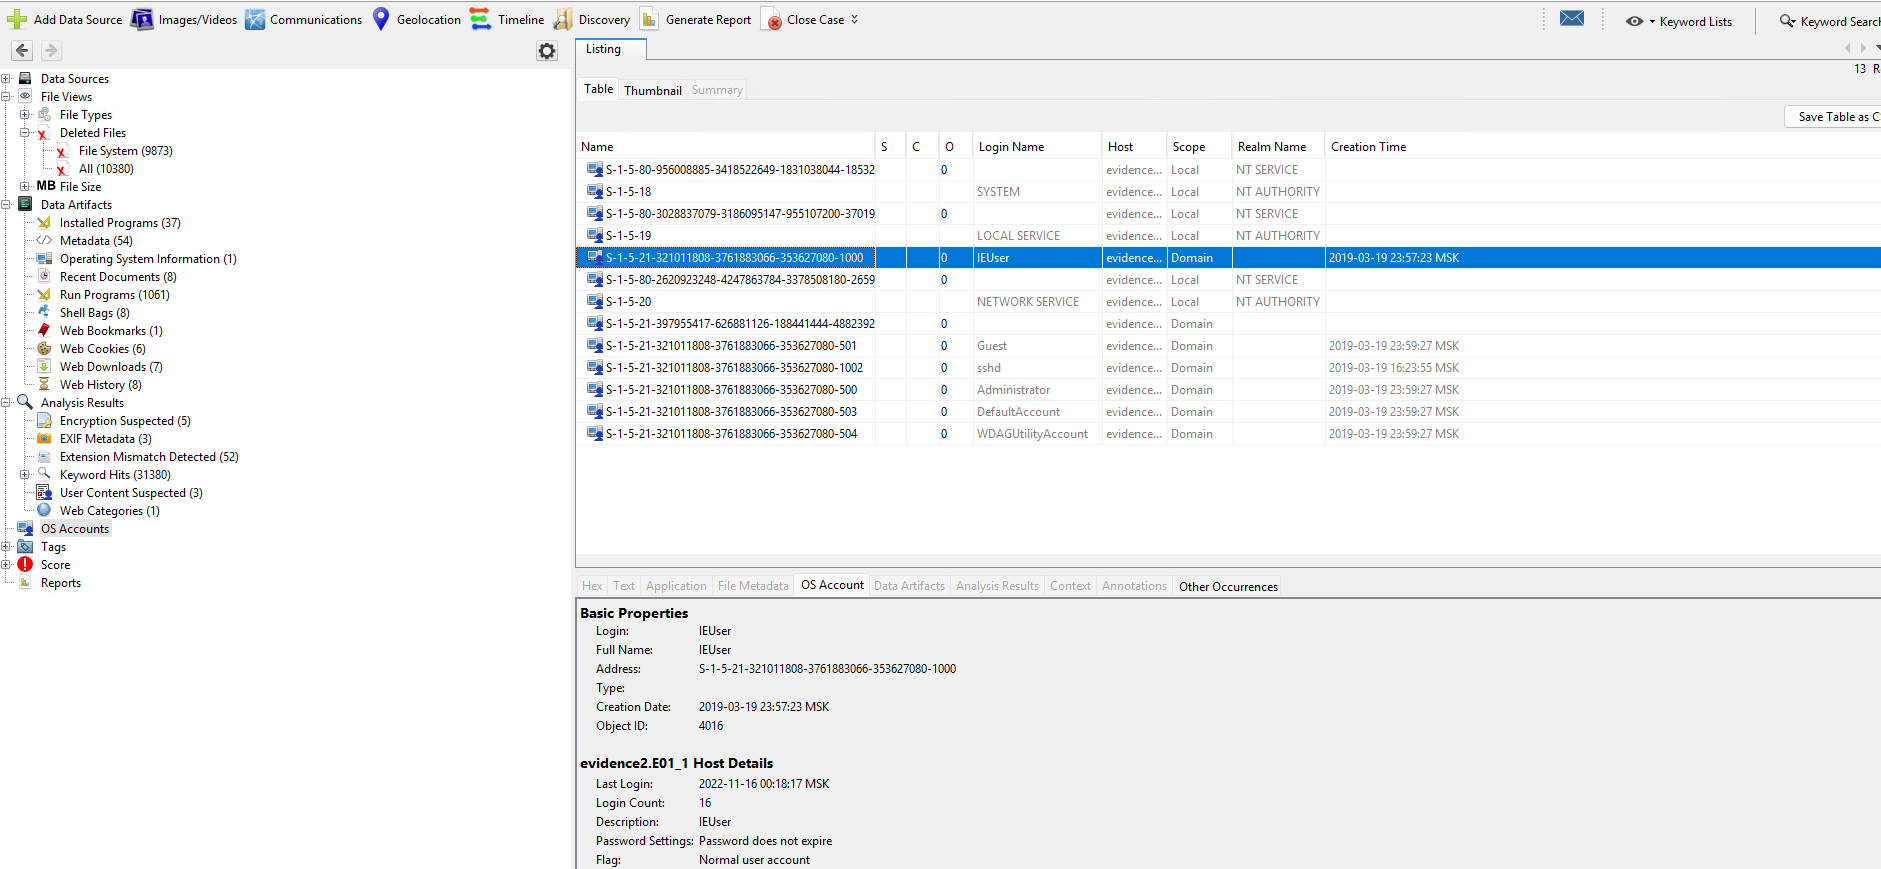
We see a set of files where this domain has already been mentioned, including ETL process trace logs, metadata of binary files, and web search history. According to the data extracted from the file, we can conclude that the Sysinternals.exe binary was downloaded from a spoofed site, as we found out earlier. To collect additional data we can go to the categories that will allow us to enrich the already existing entities and artefacts. In the Source item of the screenshot above, we know that the intruder had access to the IEUser user folder, let's move on to the list of users:
Now we know that the account is in a domain and is not a service account. We can collect additional data regarding its UID, for example the software it installed:
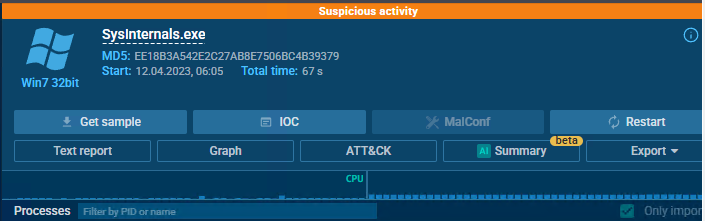
Remember that the search spotted the SDelete tool installed, which was potentially used to hide traces of activity. From a malicious resource was downloaded, just potential malware, let's check this out.

Let's go to the deleted files item, find Sysinternals and restore it by selecting Restore in the context menu.
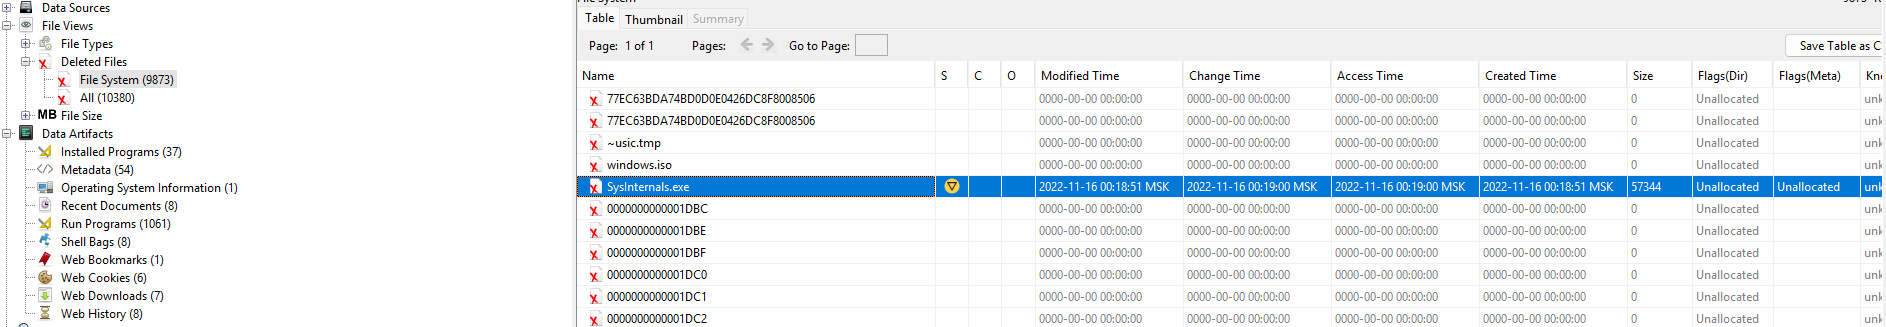
The file was marked as suspicious, so it is necessary to investigate the behaviour of this entity, i.e. to look for artifacts. And this chain of interconnected entities can be continued for a long time, having collected a set of such attributes and interconnections between them - artefacts, it is necessary to reconstruct the chain of attack.
From additional functions, you can use the search for domains, records of which were left on the machine:
You can generate analytics on a timeline to track activity in the system. To do this, go to the TimeLine item in the top menu:
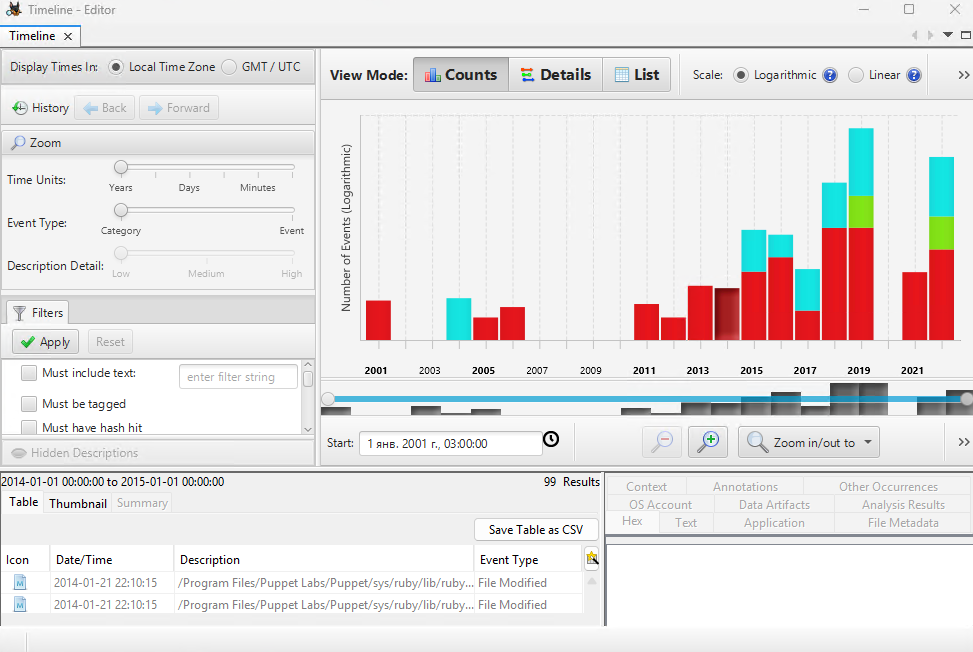
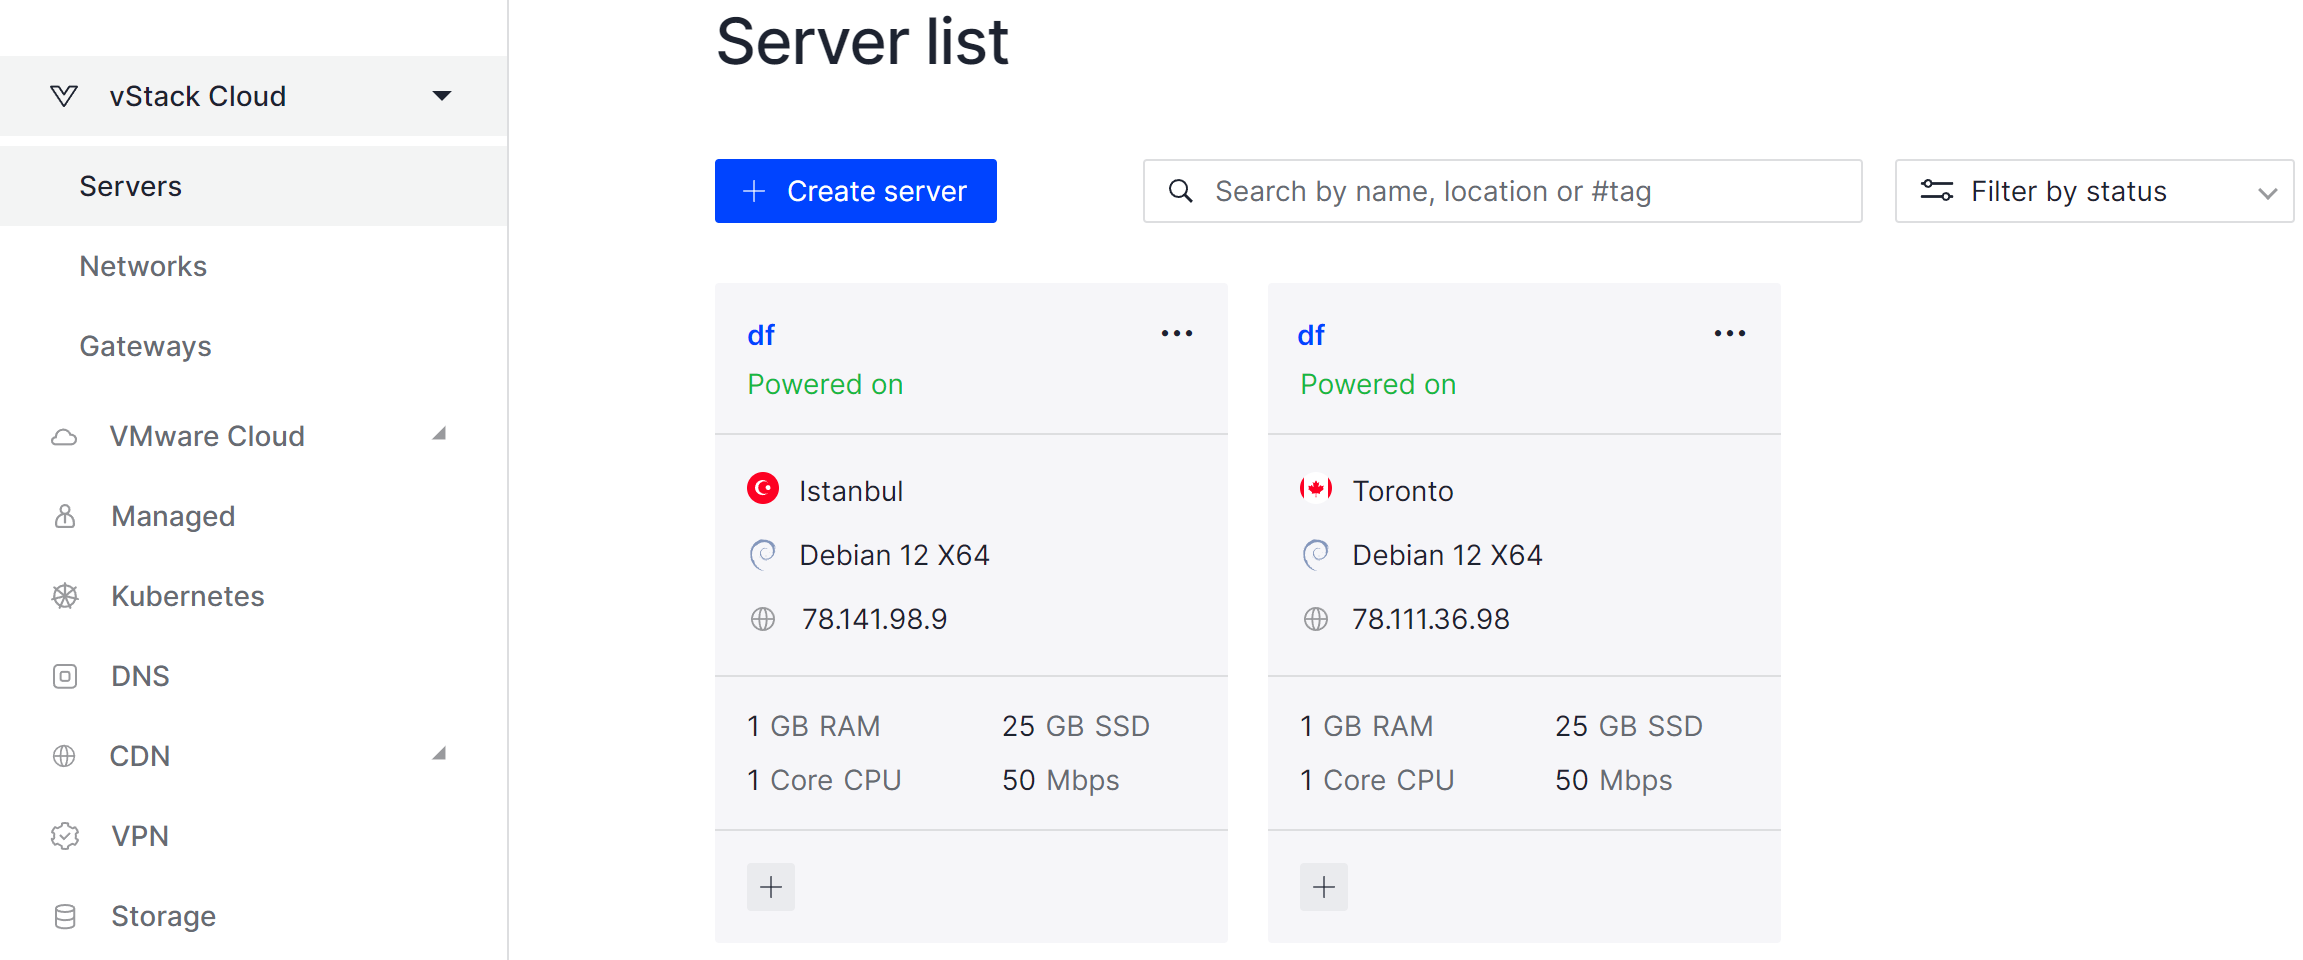
You can set filters by file type, as well as time intervals, and you can upload results to CSV. This framework is a great tool for searching attributes/artefacts, already using known data and is hardly suitable for automated analytics. However, it is an excellent parser and tool for recovering deleted/damaged files! If you don't have sufficient resources than you can perform actions on powerful cloud servers. Serverspace provides isolated VPS / VDS servers for common and virtualize usage.
FAQ (Frequently Asked Questions)
- What is Autopsy used for?
Autopsy is a digital forensics framework used to investigate incidents by analyzing data from disks, mobile devices, and network artifacts. It helps forensic investigators parse, categorize, and recover data for further manual analysis. - Can Autopsy automate the analysis process?
Autopsy primarily focuses on data parsing and taxonomization. While it simplifies the collection of artifacts and entities, most detailed analysis still needs to be performed manually. - Which types of data sources can Autopsy handle?
Autopsy supports a wide range of data sources, including non-volatile storage devices, disk images, network logs, and user activity files. - Can Autopsy recover deleted or damaged files?
Yes, Autopsy has robust tools for restoring deleted or damaged files, making it a valuable resource in reconstructing attack chains or investigating incidents. - Is Autopsy suitable for cloud or virtualized environments?
Yes, Autopsy can be deployed on powerful cloud servers or virtual private servers (VPS/VDS) for resource-intensive investigations, allowing faster processing of large datasets. - Does Autopsy replace traditional forensic analysis tools?
No, Autopsy complements other forensic tools by providing efficient parsing, taxonomization, and recovery capabilities, but it does not replace manual analysis or specialized analytics software.


