
The main components in any information-computing system are the subsystem of authentication and identification, authorisation, backup and, of course, infrastructure load monitoring. Means, methods that can realise these functions depend on each specific case.
If we consider a medium and large corporate network infrastructure, then most likely for effective monitoring we will need a client-server solution, which will have a light agent for different types of OS and a fault-tolerant server, for example, Zabbix. For small systems we will use local solutions, which will allow us to manually take measurements from the machine, as well as this tool will be useful in the moment of quick assessment of the server.

Data collection utility atop Linux
Let's imagine that the customer has provided his server for deployment of services and we have no idea about its capacity and possible processes running and expected to run in cron, virtualisations and so on. We can measure it with basic utilities, but then we will see the load on it only at the moment of use and it will not give a complete picture. For this purpose, there is a tool atop, which allows you to save data about the load on the machine in chronological order with a certain interval.
To test the utility, let's deploy the cloud server on Serverspace by selecting one of the cloud platforms and click on the Create Server button.
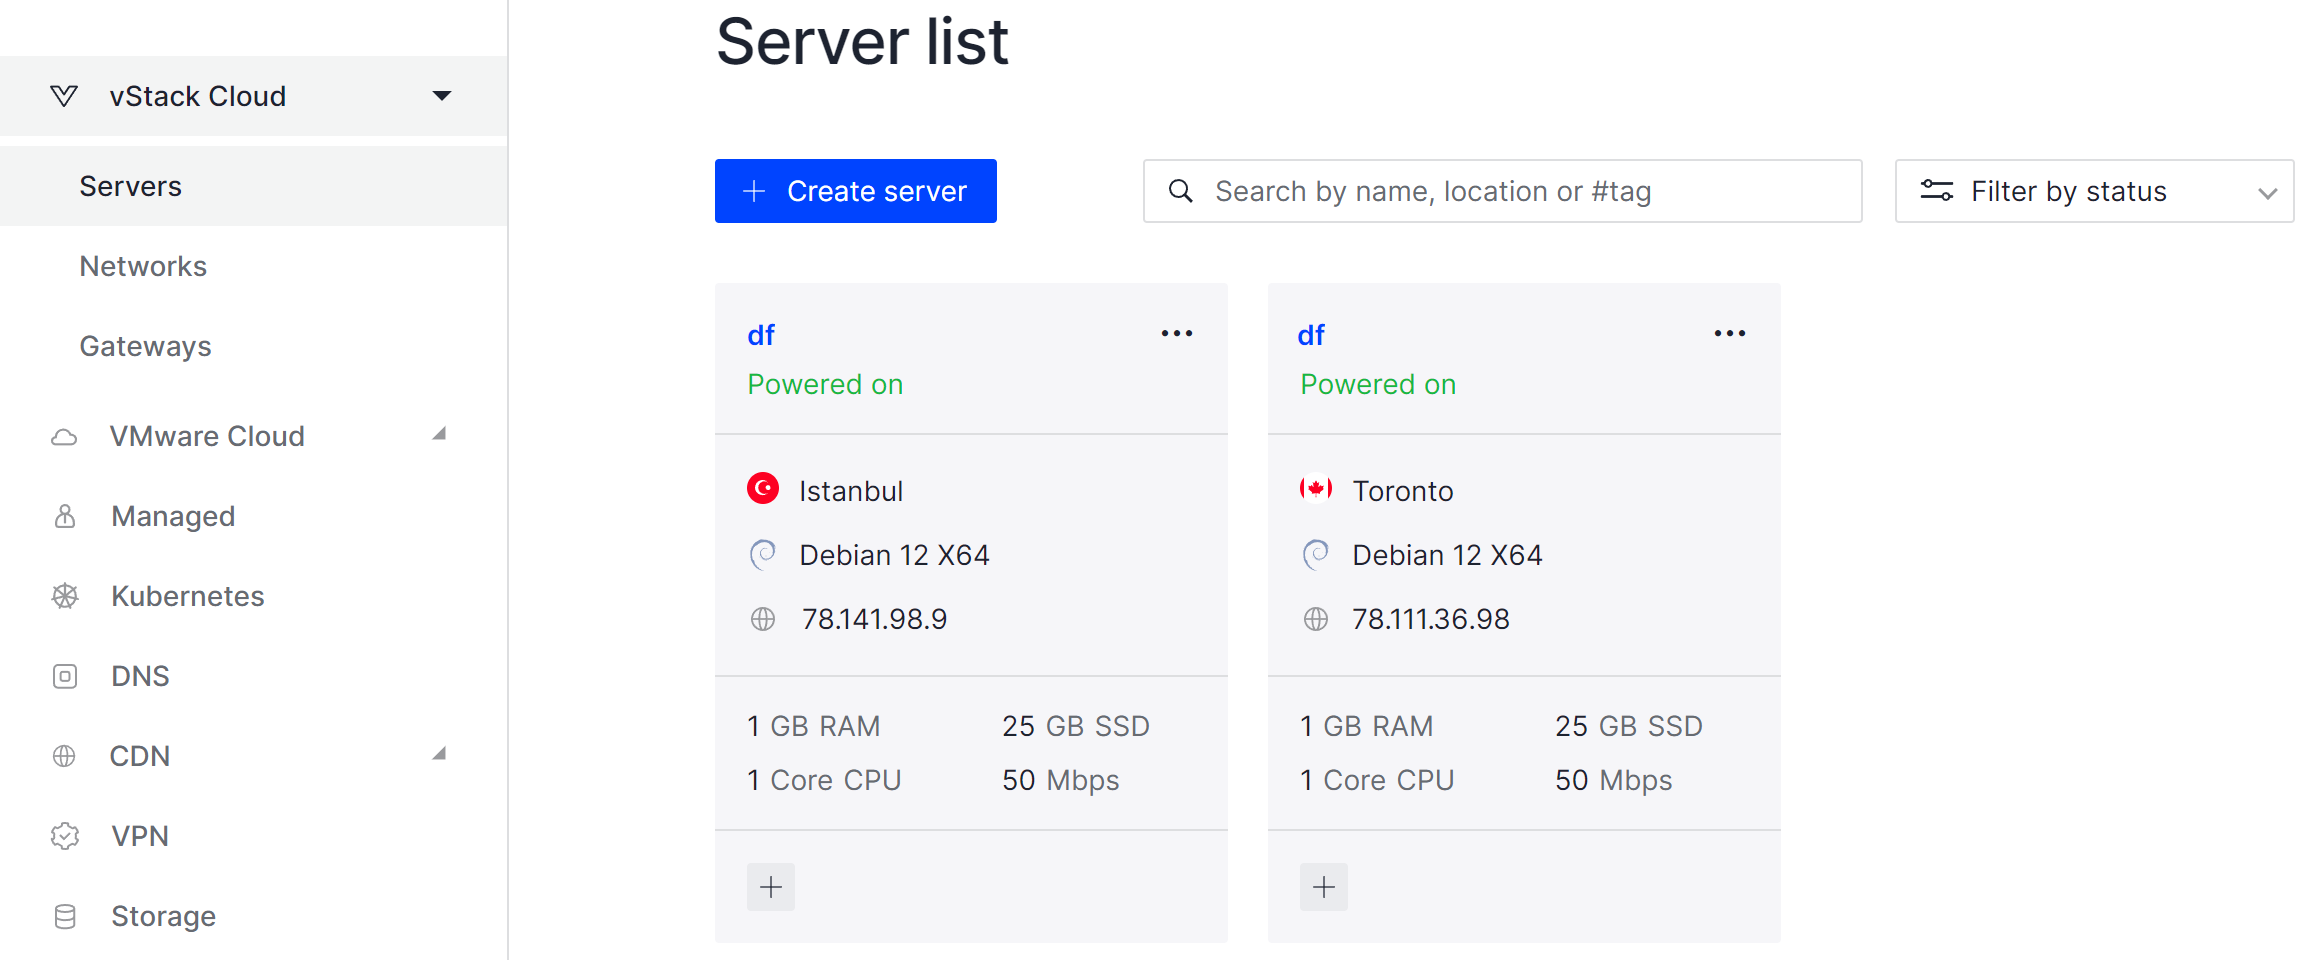
After selecting the data centre where we want to deploy our server and specify the basic parameters for it: CPU, RAM, Hard Disk and network interface. Set a name and click on the Order button. Great, now we can connect via SSH by specifying a key or password for user authentication. On the right side of the main panel you can see more detailed instructions to connect securely.
In Debian/Ubuntu we will use the apt package manager and the appropriate syntax for it, if you are using a different distribution then consider the syntax of your package manager and specify atop to install at the end. Type the following command into a terminal window:
apt update && apt upgrade -y Once the indexes and packages are updated, we can start installing atop:
apt install atop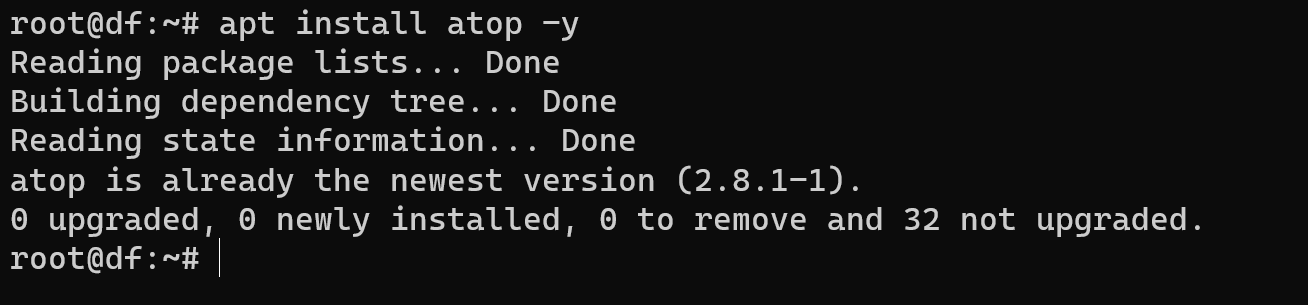
A distinctive feature of atop is the ability to view the load on the 4 main parameters not only in total, but also separately for each process. Let's launch the process manager and look at its appearance.
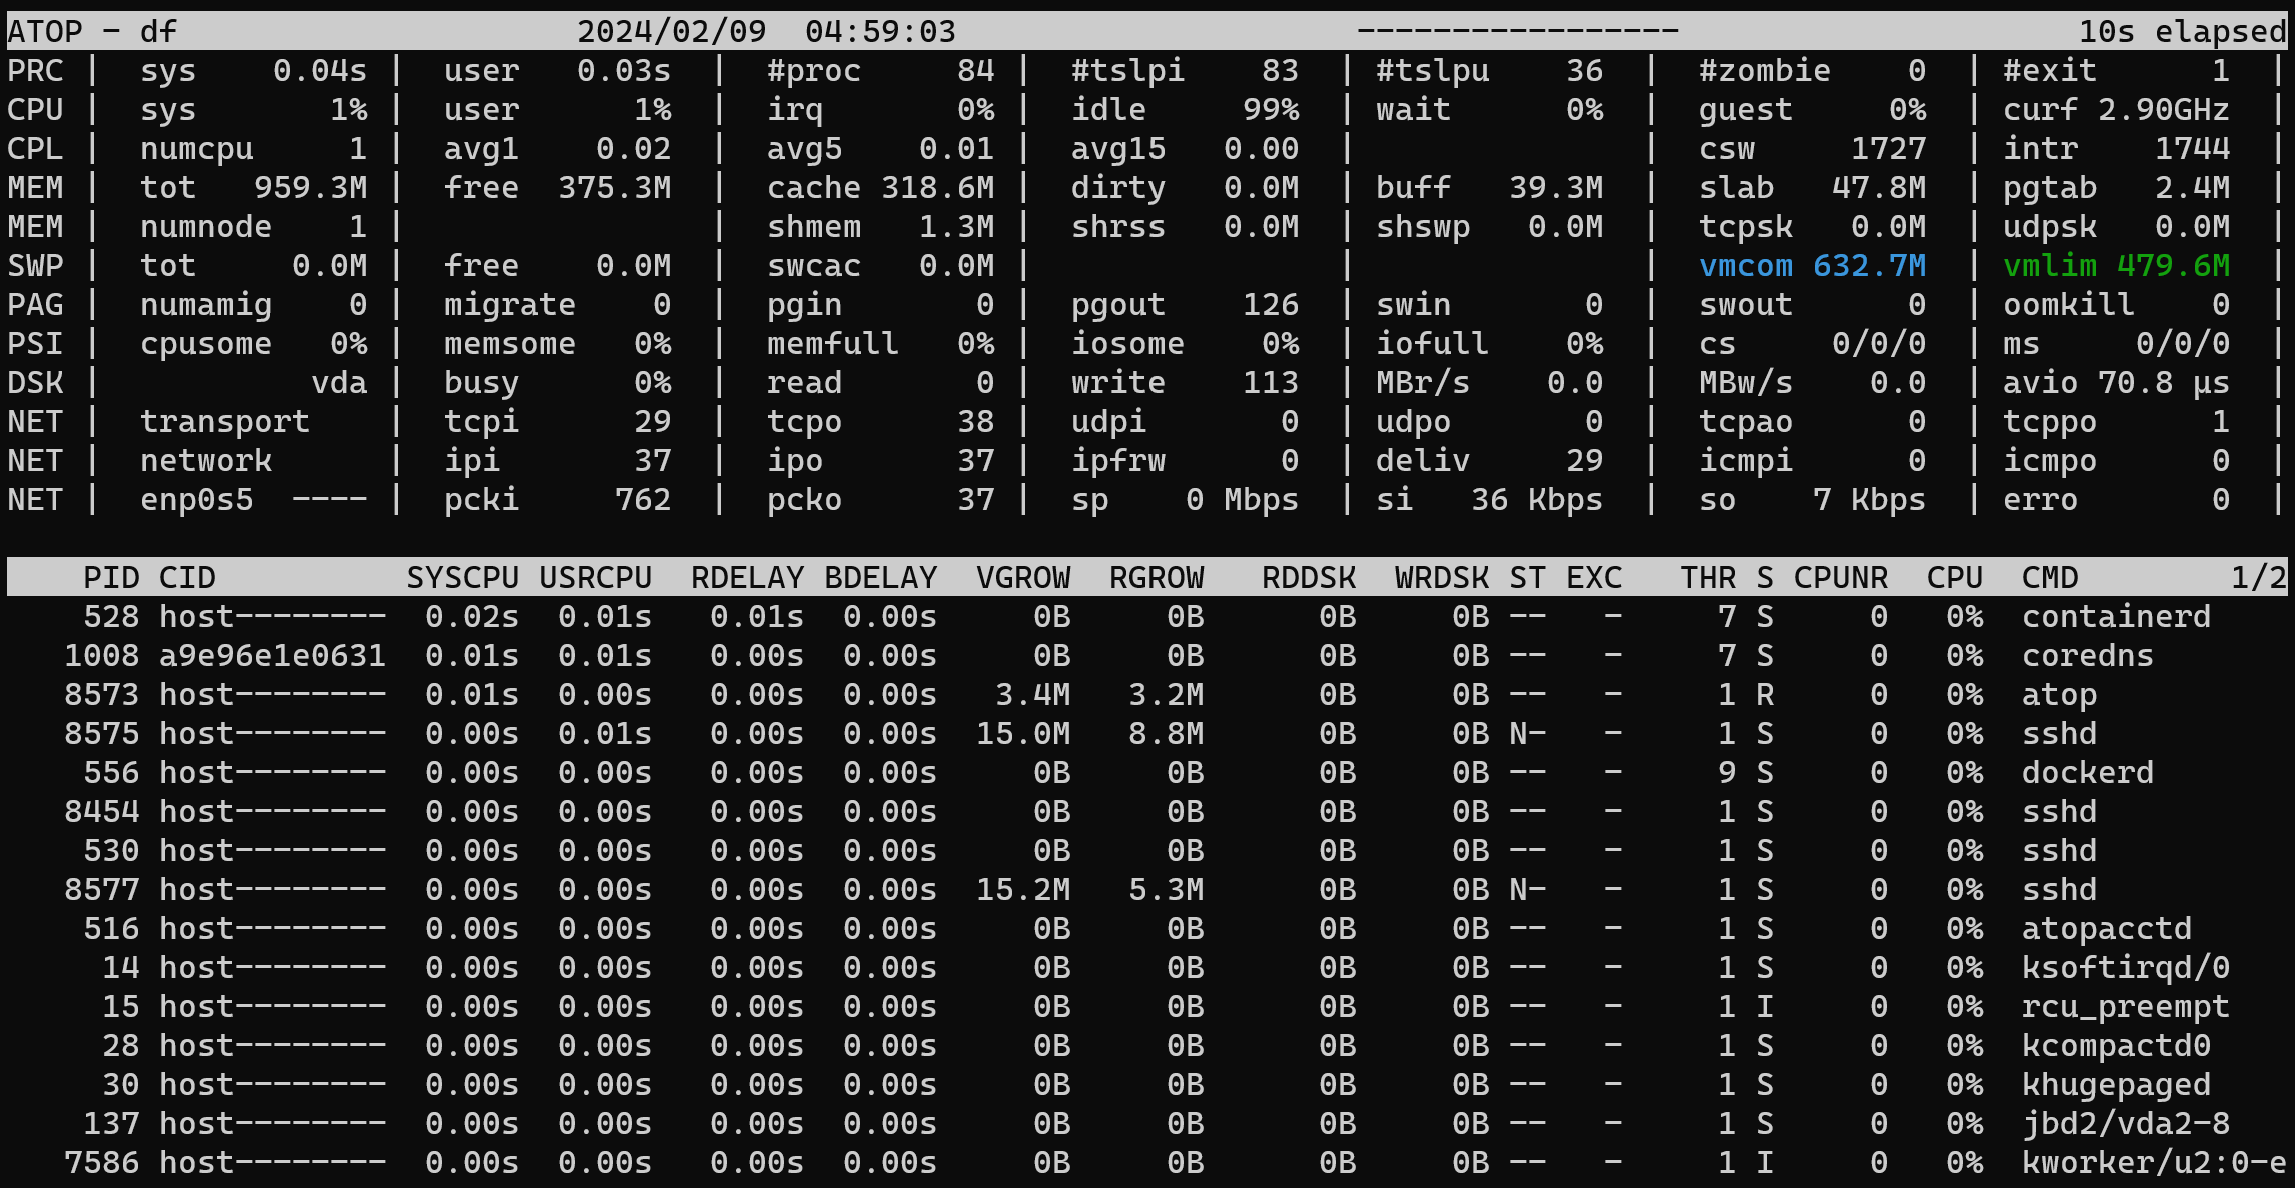
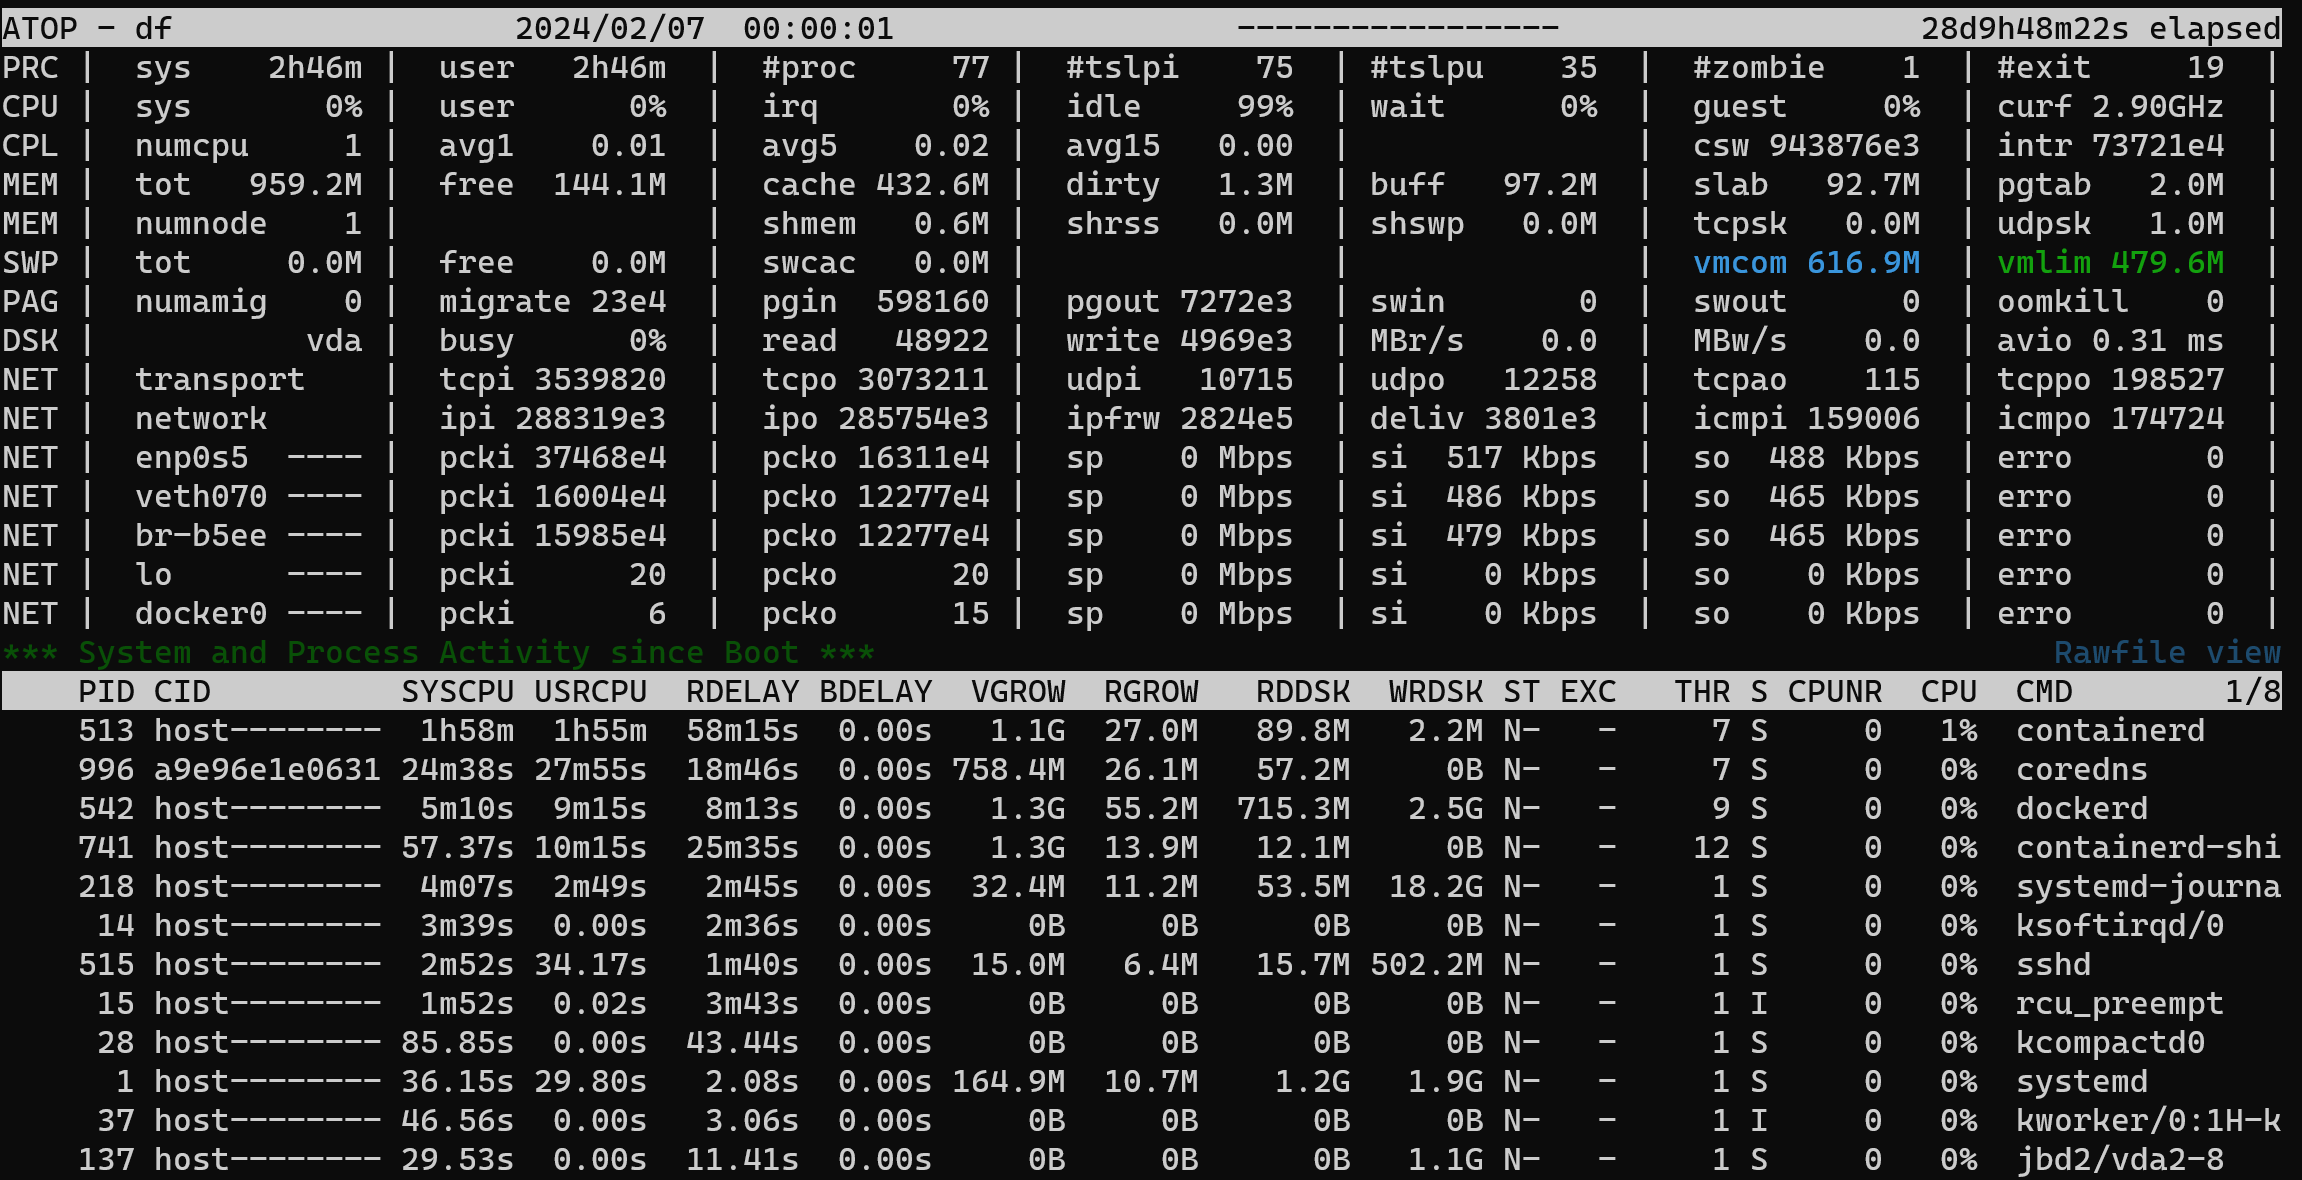
The screen is divided into two horizontal fields, each of which provides detailed information on each of the processes. On the top is the total system information describing the real-time load on the 4 main parameters and on the bottom is the same but broken down by process. To pause monitoring press z, to exit the panel press q and to change the period of data update i. Also an interesting feature of atop is logging system performance at night every 10 minutes by default.
Measurement during the period
Usually, the data is stored in the /var/log/atop directory with the notation atop_YYYYYYYYMMDD, which indicates the date the record was saved. Decode the data using the command:
atop -r /var/log/atop/atop_20240207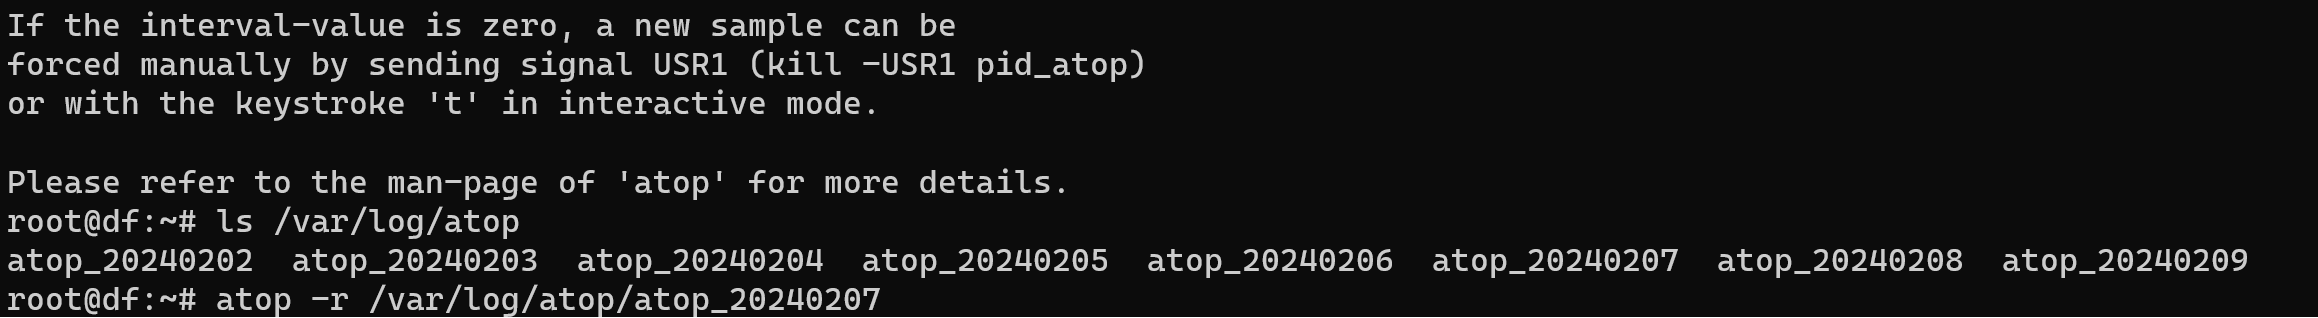
In your case, replace with a file that belongs to your system. After writing the command, we can see the interpreted results of the record file.
The collection time depends on the parameters you specify, by default the utility takes a screenshot once a day, measuring the results at one point in time. You can view the records for the current day thanks to the command:
atop -rTo start recording, use the following atop -w file [-S] [-a] [interval [samples]] command syntax. Where the -w option specifies the recording file, -S records system calls, and -a specifies the data to be recorded from all processes, not just those currently active. Interval specifies the period of time between snapshots and samples as the number of snaps needed. When the task is completed by snaps, the recording is terminated, however, if they are not specified, it will continue until manually stopped. For example, let's create a task to record 5 snaps at 5-second intervals:
atop -w /var/log/atop.lognight 5 5 After the process is running, we can go to the folder and open the newly created record:
atop -r /var/log/atop.lognight 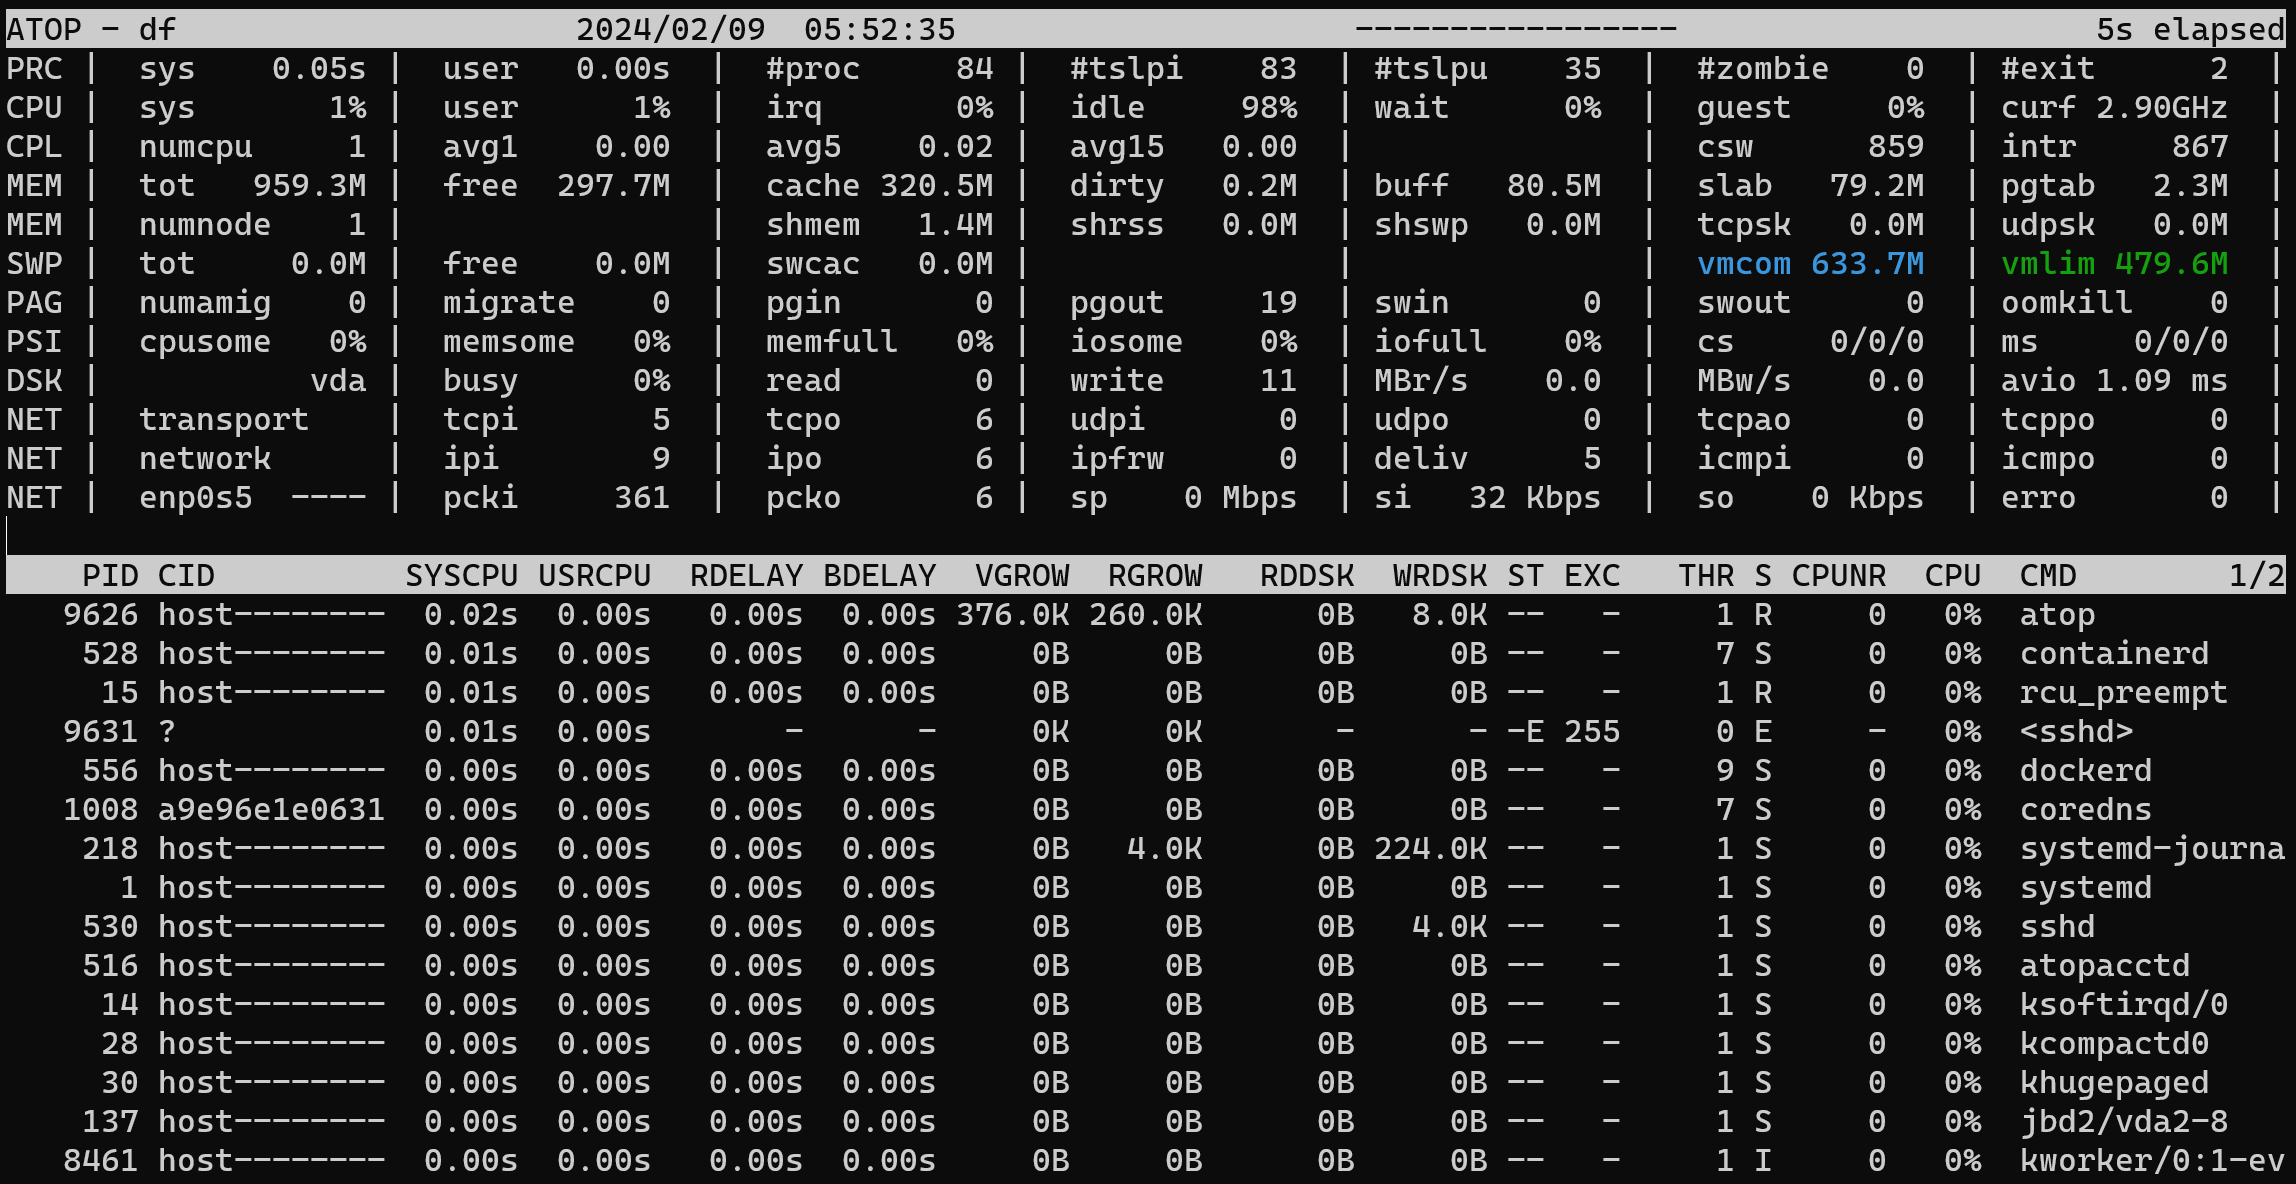
To move between intervals we use the t key, to go to the past we use shift+t, of course the difficulty is that you have to compare the values manually with your eyes. If we were using Zabbix, this chronology of the server load could be reflected in the form of a graph. But if there is no way to deploy it, atop is still a good solution, because here you can change the output mapping by process with hotkeys. For a more perceptible view, let's filter the processes by:
- m - sort by memory usage;
- d - sort by disc activity;
- u - show activity table by users;
- v - display detailed information about processes;
- g - return to the standard output.
But if we press Shift + the above options, the values will not only be filtered, but also sorted by the selected option.
A little bit more about management, if we don't want to run through a large list of snaps, we can use the -b combination and specify the time in YYYYYYMMDDDDDhhmm format to search for the desired interval.
Although atop provides a lot of data, its interface is intuitive and allows us to conveniently monitor processes and system resources. A combination of hotkeys allows you to quickly filter and sort the data to get the information you need.
Thus, atop is a useful tool for analysing system performance and monitoring load, especially in situations where more sophisticated and scalable monitoring systems are not available.


