Resource monitoring is an essential aspect of managing any system, whether it's a computer system, a network, or a server. By monitoring resources, we can get valuable insights into how our systems are performing, identify potential issues before they become critical problems, and optimize resource usage to improve performance and reduce costs.
Here are some specific reasons why monitoring resources is important:
- Performance optimization — Resource monitoring helps identify performance bottlenecks so that administrators can take corrective action to improve the system's performance. For example, if we notice that CPU usage is consistently high, we might upgrade the hardware or adjust the workload distribution to balance the load more effectively.
- Capacity planning — Resource monitoring provides information on how much capacity is being used, allowing administrators to make informed decisions about when to add more resources to support growing demand. This helps ensure that the system has enough capacity to meet current and future demands.
- Cost control — Resource monitoring helps track resource usage, which can help organizations identify opportunities to reduce costs by optimizing usage and retiring unused resources.
- Security — Monitoring resources can also help detect potential security threats by providing visibility into unusual activity or patterns that may indicate a breach or other unauthorized access.
Overall, resource monitoring is an essential tool for ensuring the optimal performance, scalability, and security of IT systems.

Software for installation
In that article we will use bundle for build that monitoring, alerting and visualize system. MongoDB, Graphana, Prometheus will provide interesting solution for our purposes. Graphana it's system which includes many modules and forms from it visualize system. Very comfortable. Prometheus plays an equally significant role: monitoring, alerting and transporting data. MongoDB it's common data base with save data as main function. Let's have a look for this!
Install and exploit monitoring system
Before using the main utility update and upgrade your system:
sudo apt update -y && sudo apt dist-upgrade -y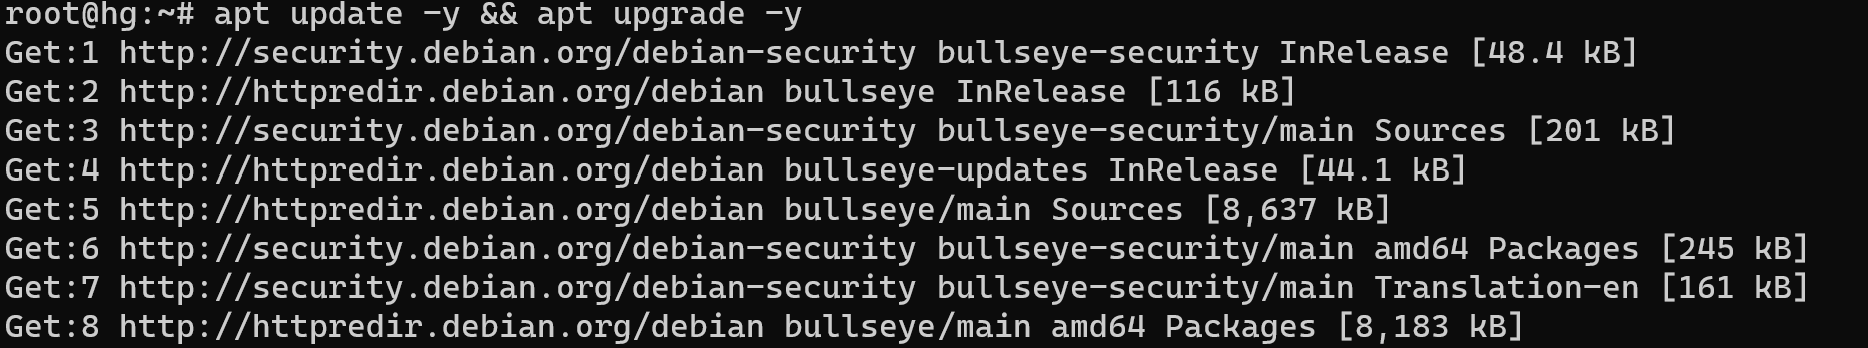
For pulling container you need to register on DockerHub, please fill all needed fields and check email for confirmation:
With next step download all requirements and software:
apt install docker.io 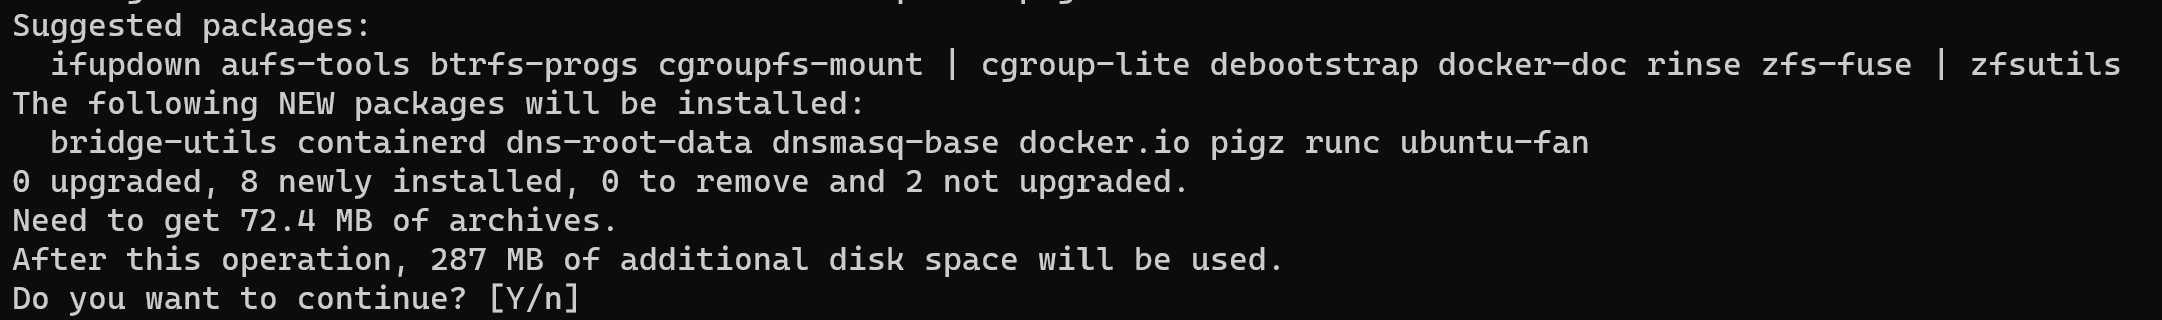
Then we need to login into the account on our server via command below:
docker login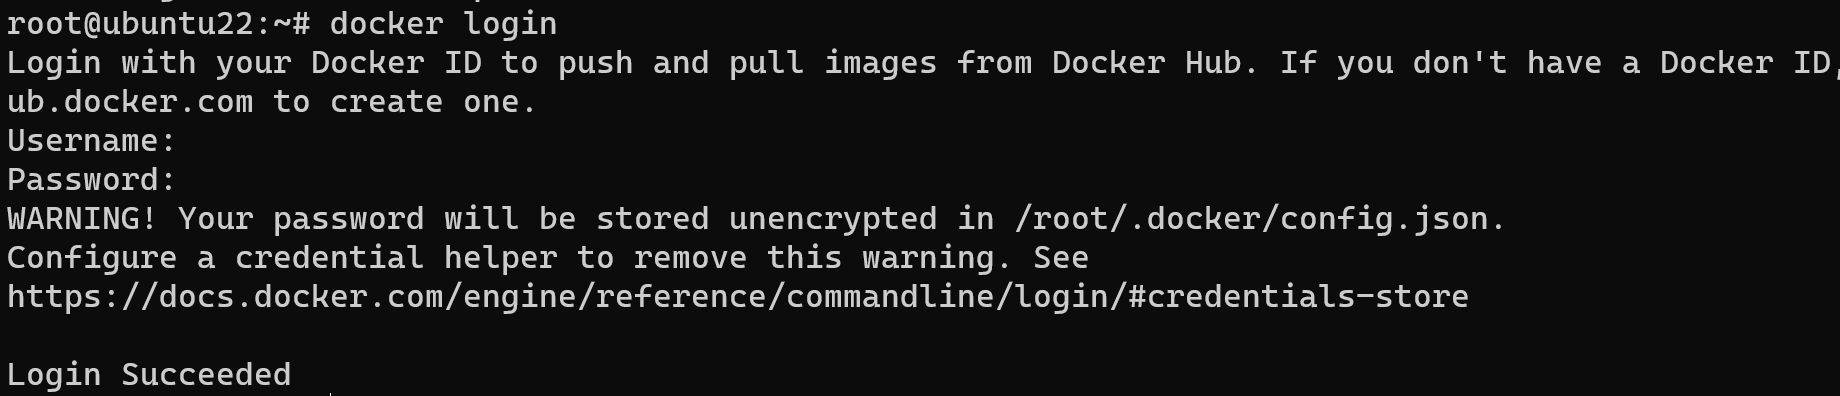
You will not see the typing password, but all letters and symbols will be entered! We need to pull all needed container wich have libraries and сompiled system application:
docker pull grafana/grafana && docker pull prom/prometheus && docker pull ranchercharts/bitnami-mongodb-exporter:0.8.0-debian-9-r4 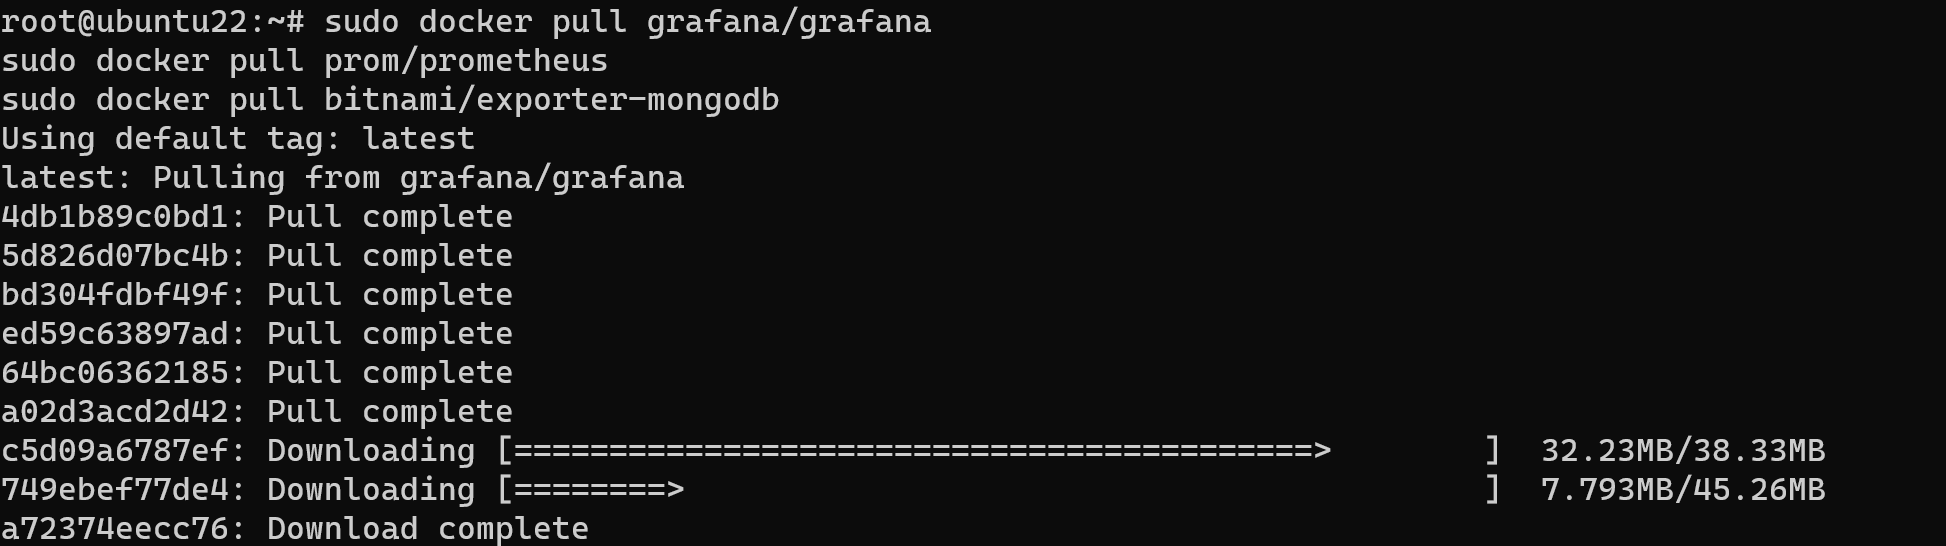
After this we need to build a dependencies between database and monitoring system, let's create configuration file in folder:
cd / && mkdir /conf && nano conf/prometheus.yml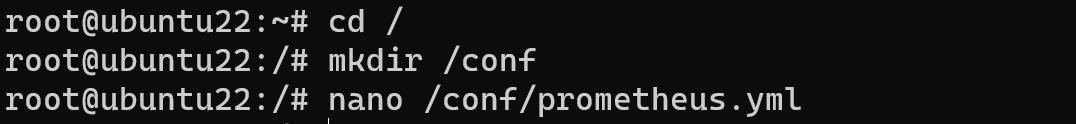
Enter in configuration files next parameters:
global:

scrape_interval: 15s # how often to scrape targets by default

evaluation_interval: 15s # how often to evaluate rules by default
scrape_configs:

- job_name: 'mongodb-exporter'

scrape_interval: 5s

static_configs:

- targets: ['mongo-exporter:9216']
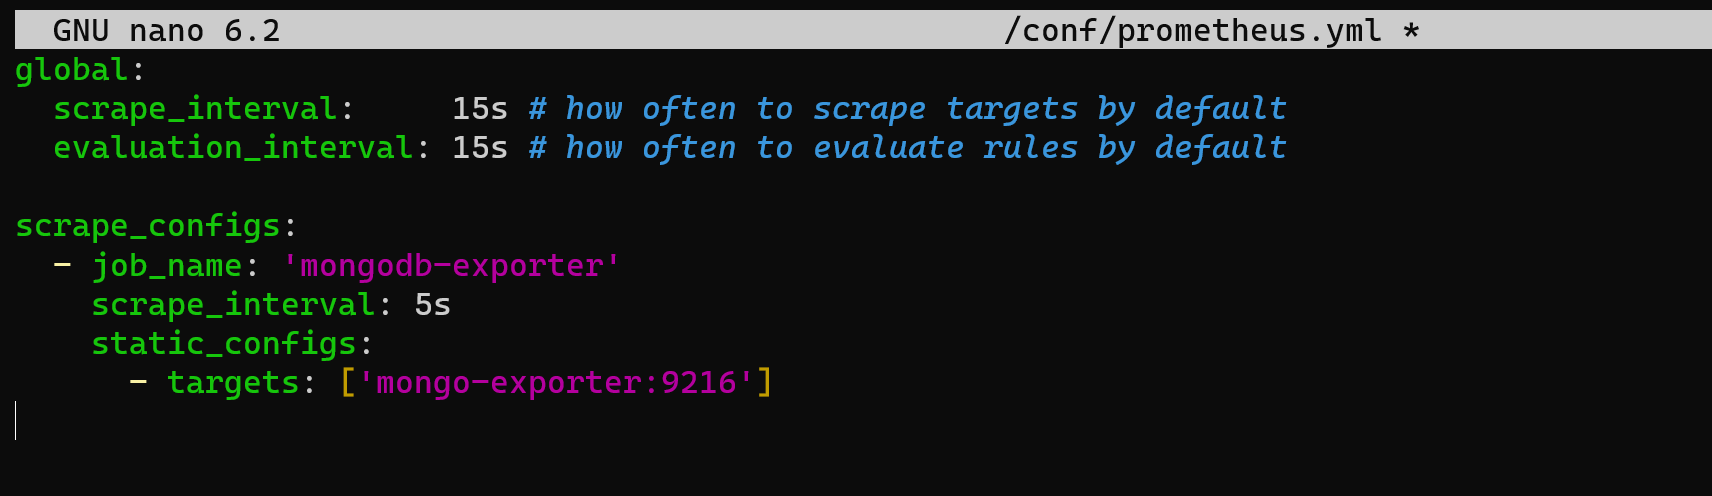
In that parameters we have indicated MongoDB and port for communication and export data. Press button combination Ctrl + O for save config and Ctrl + X for exit from text editor. Now run container with our modules:
sudo docker run -d --name=grafana -p 3000:3000 grafana/grafanasudo docker run -d --name=prometheus -p 9090:9090 prom/prometheussudo docker run -d --name mongodb-exporter -p 9216:9216 ranchercharts/bitnami-mongodb-exporter:0.8.0-debian-9-r4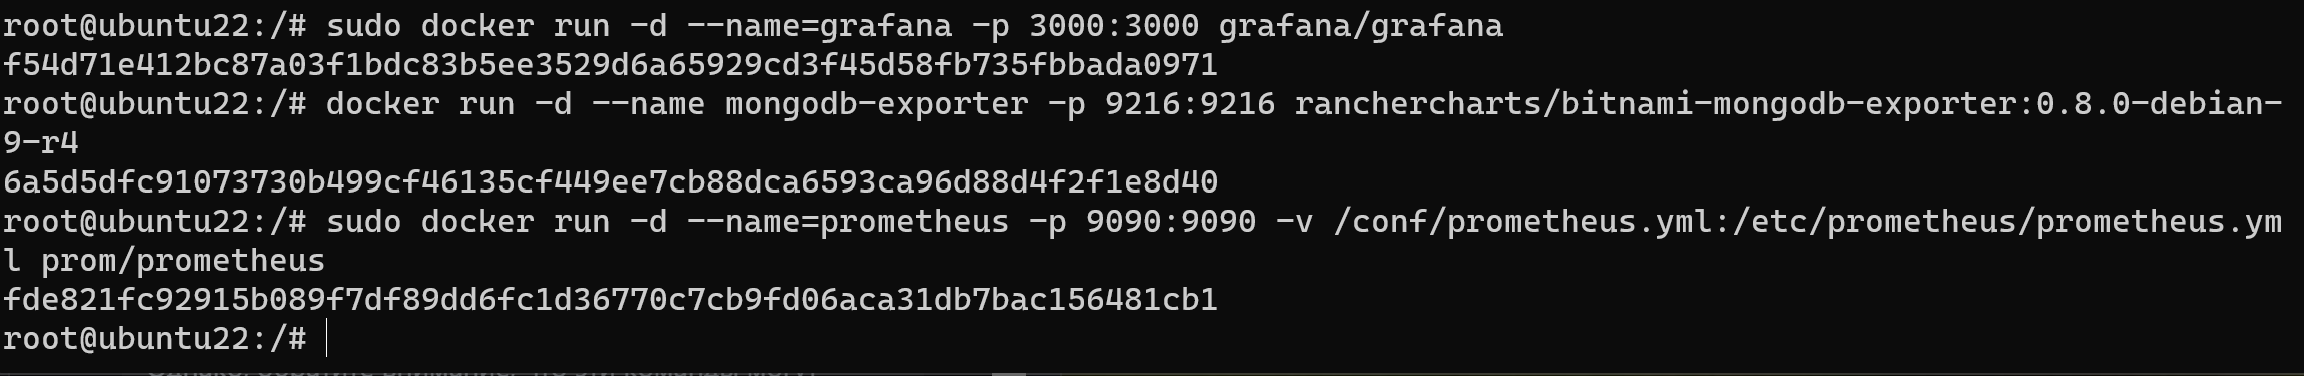
In output we will see ID for every container in process. Let's check it:
docker ps -a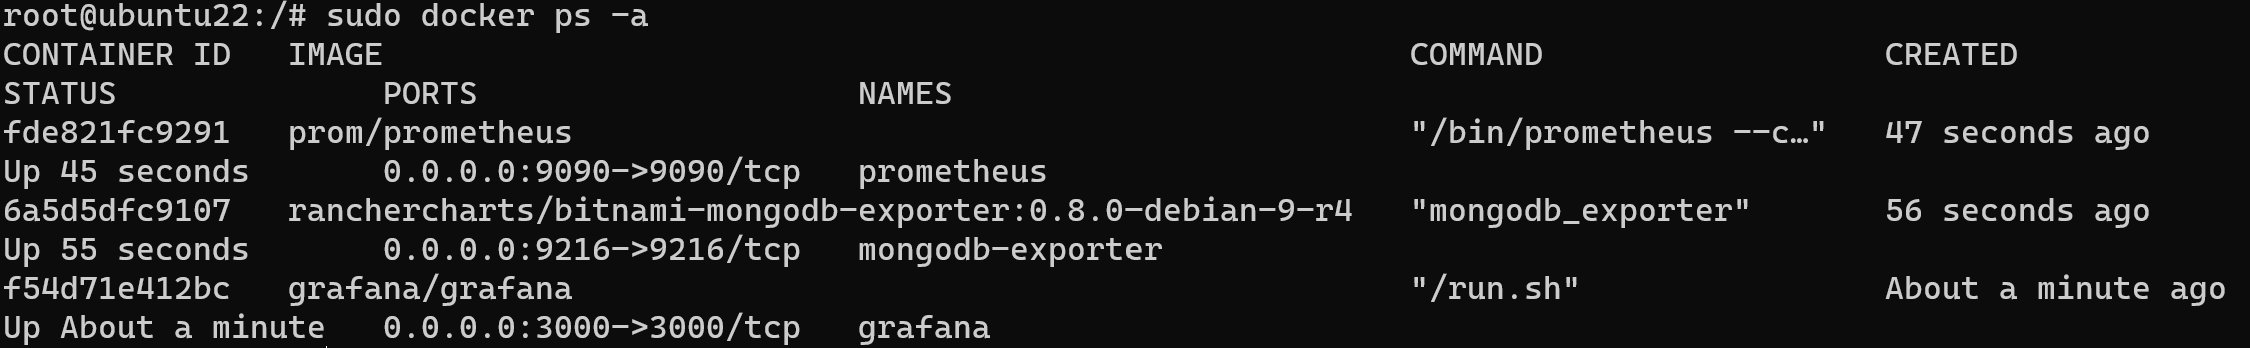
If all process will alright, so we can go ahead and install graphical shell for system via command:
apt-get install ubuntu-gnome-desktop
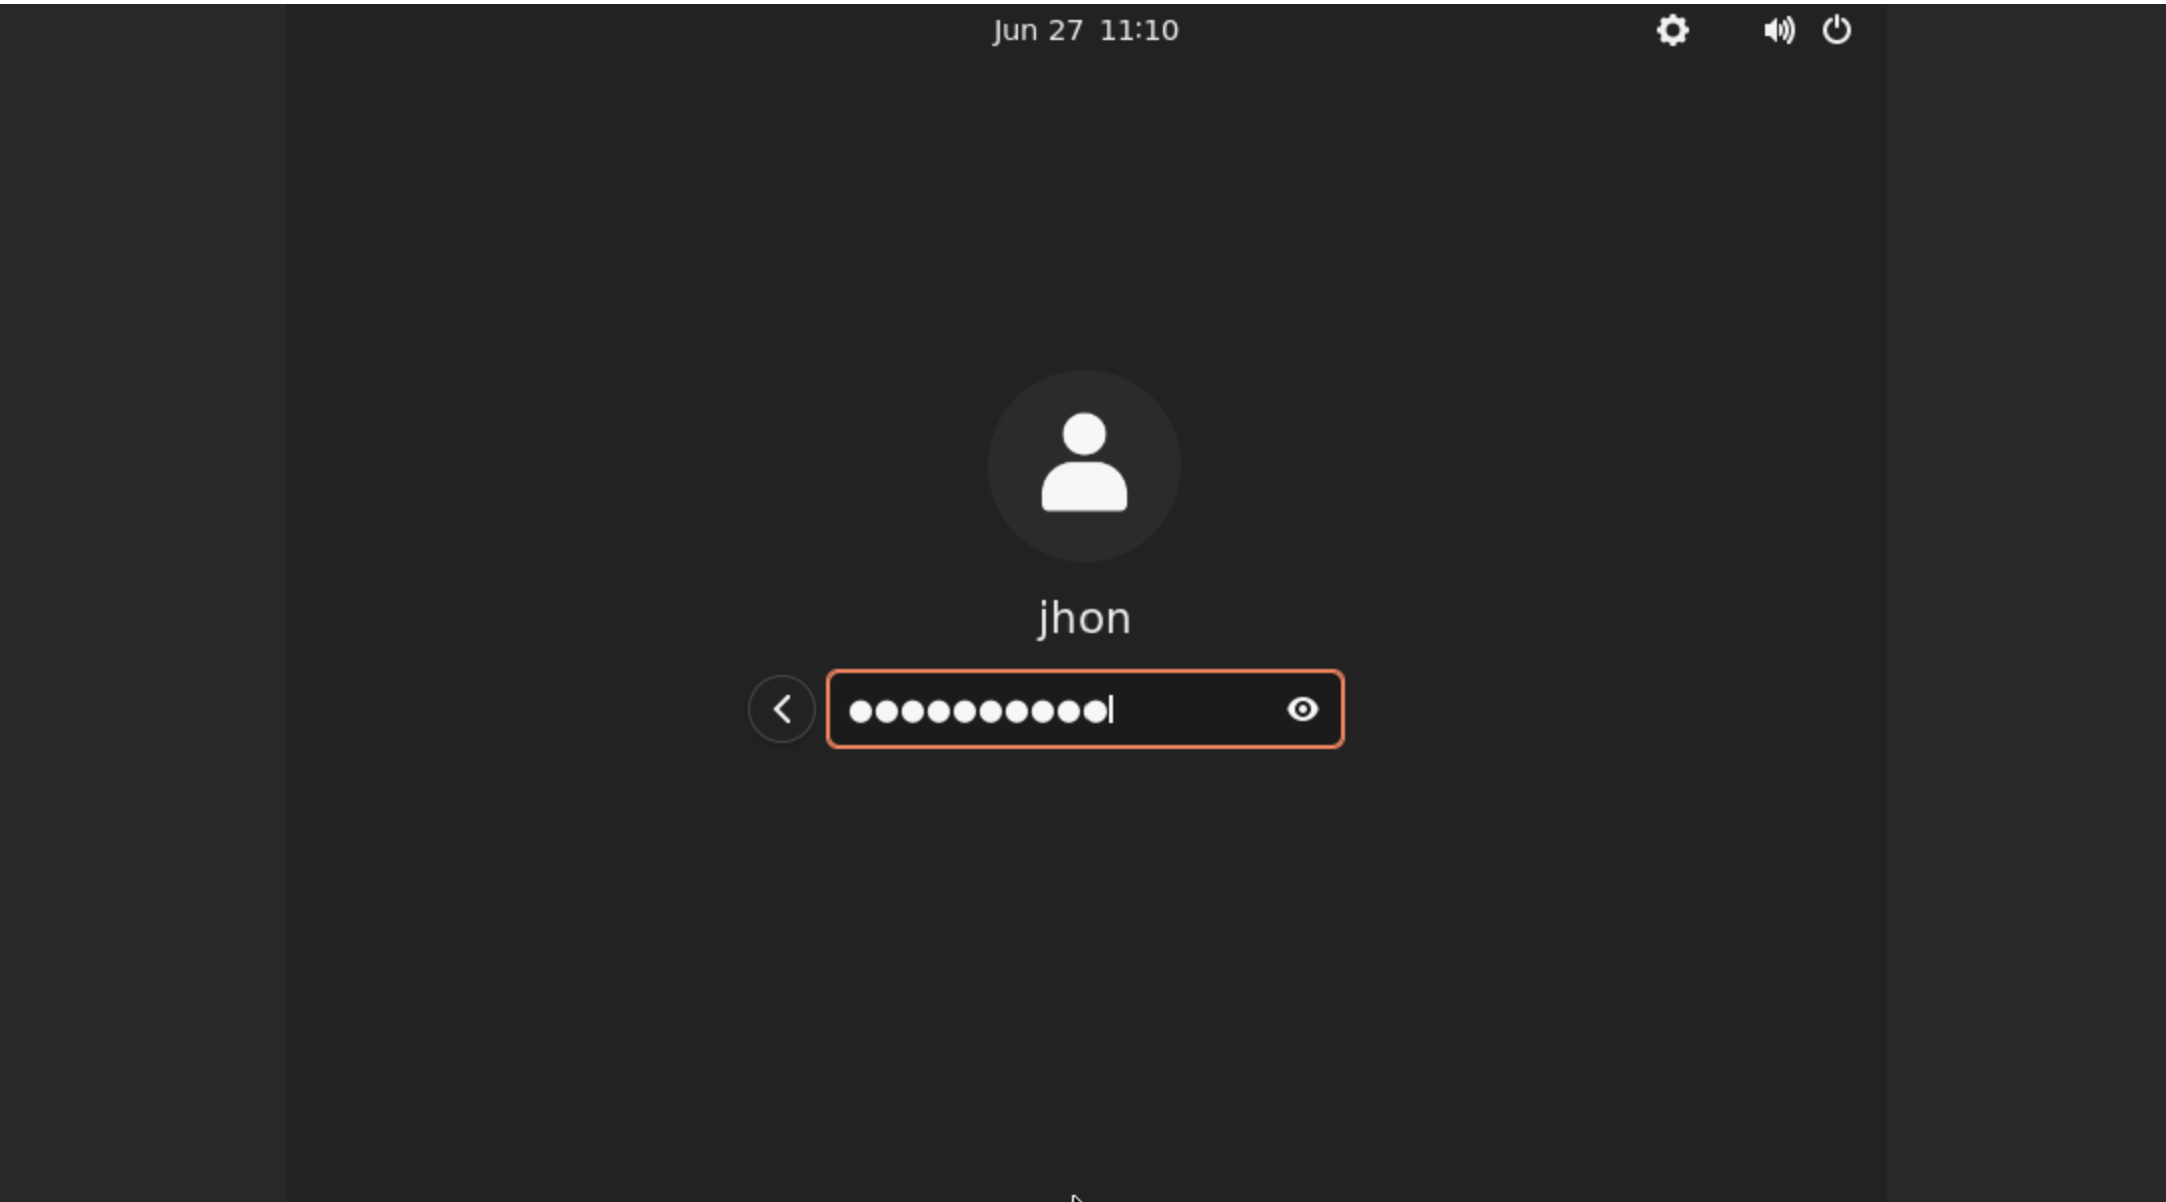
Be patient and wait for the end of the installation all shell and then reboot system via command:
rebootAfter this server will restart and we will see panel for login, write your credentials and enter:
For our purposes we need to install Firefox browser and wait end of installation:
sudo apt install firefox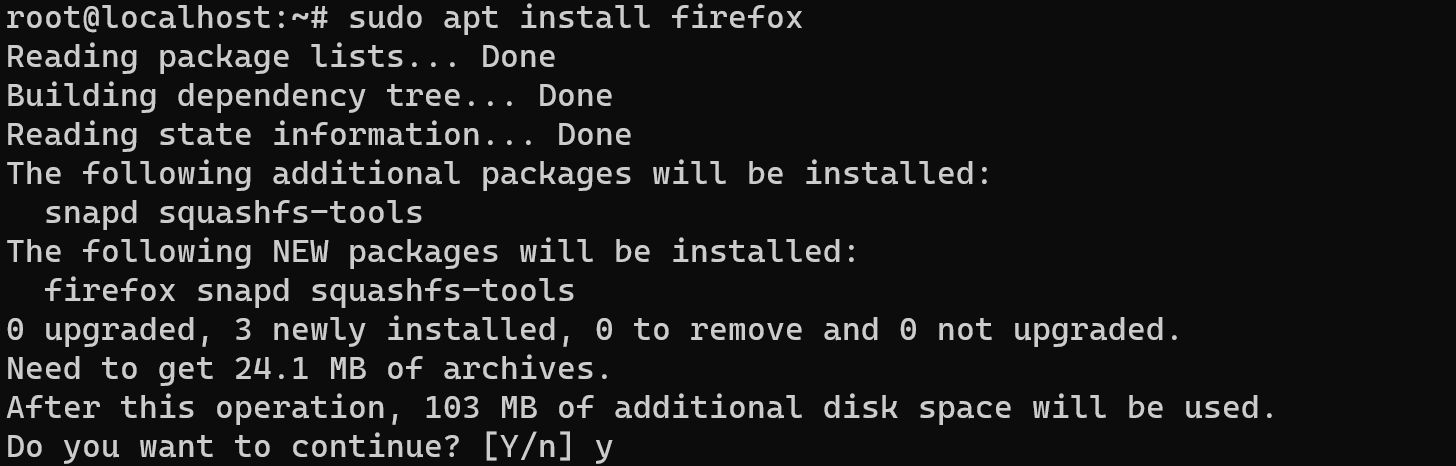
Run on the Desktop browser for next step:
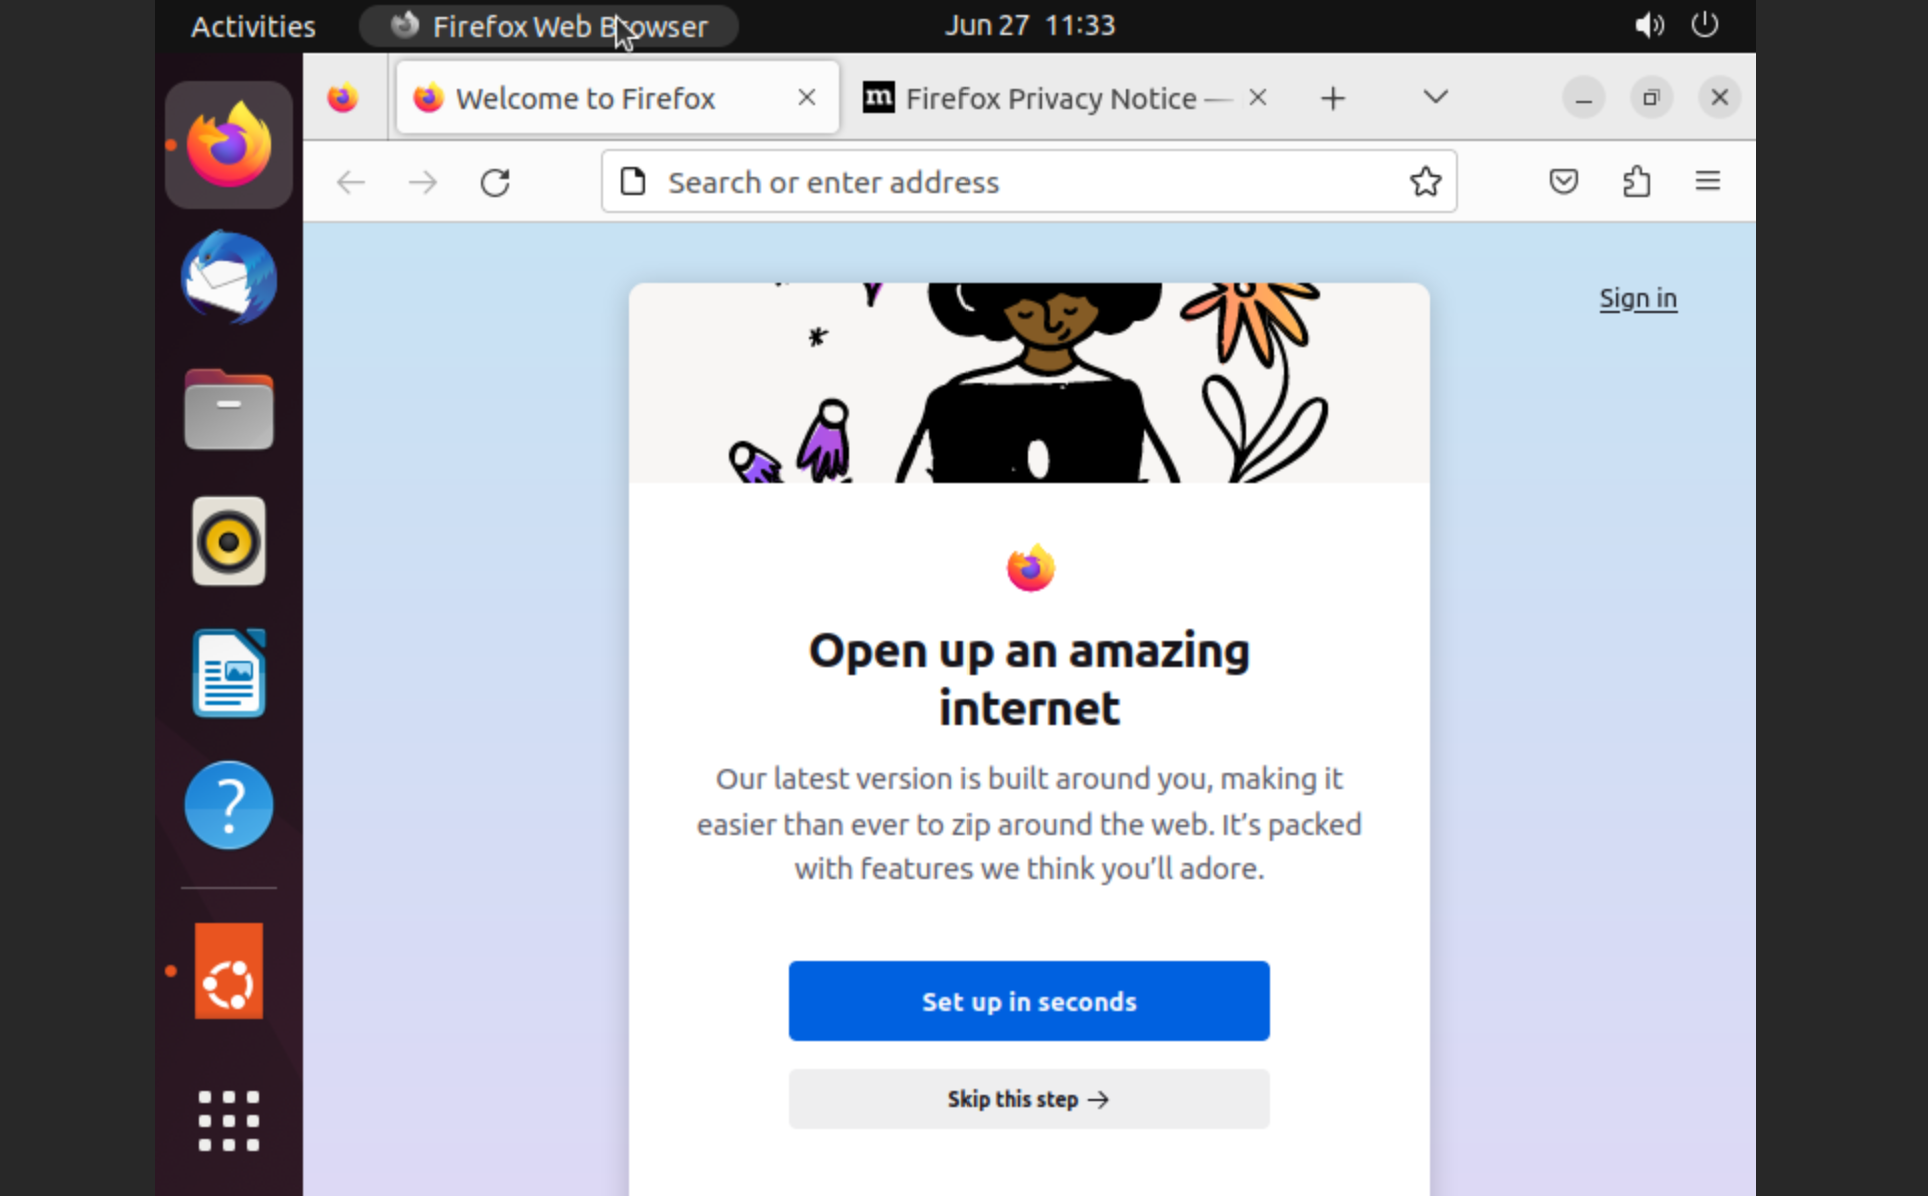
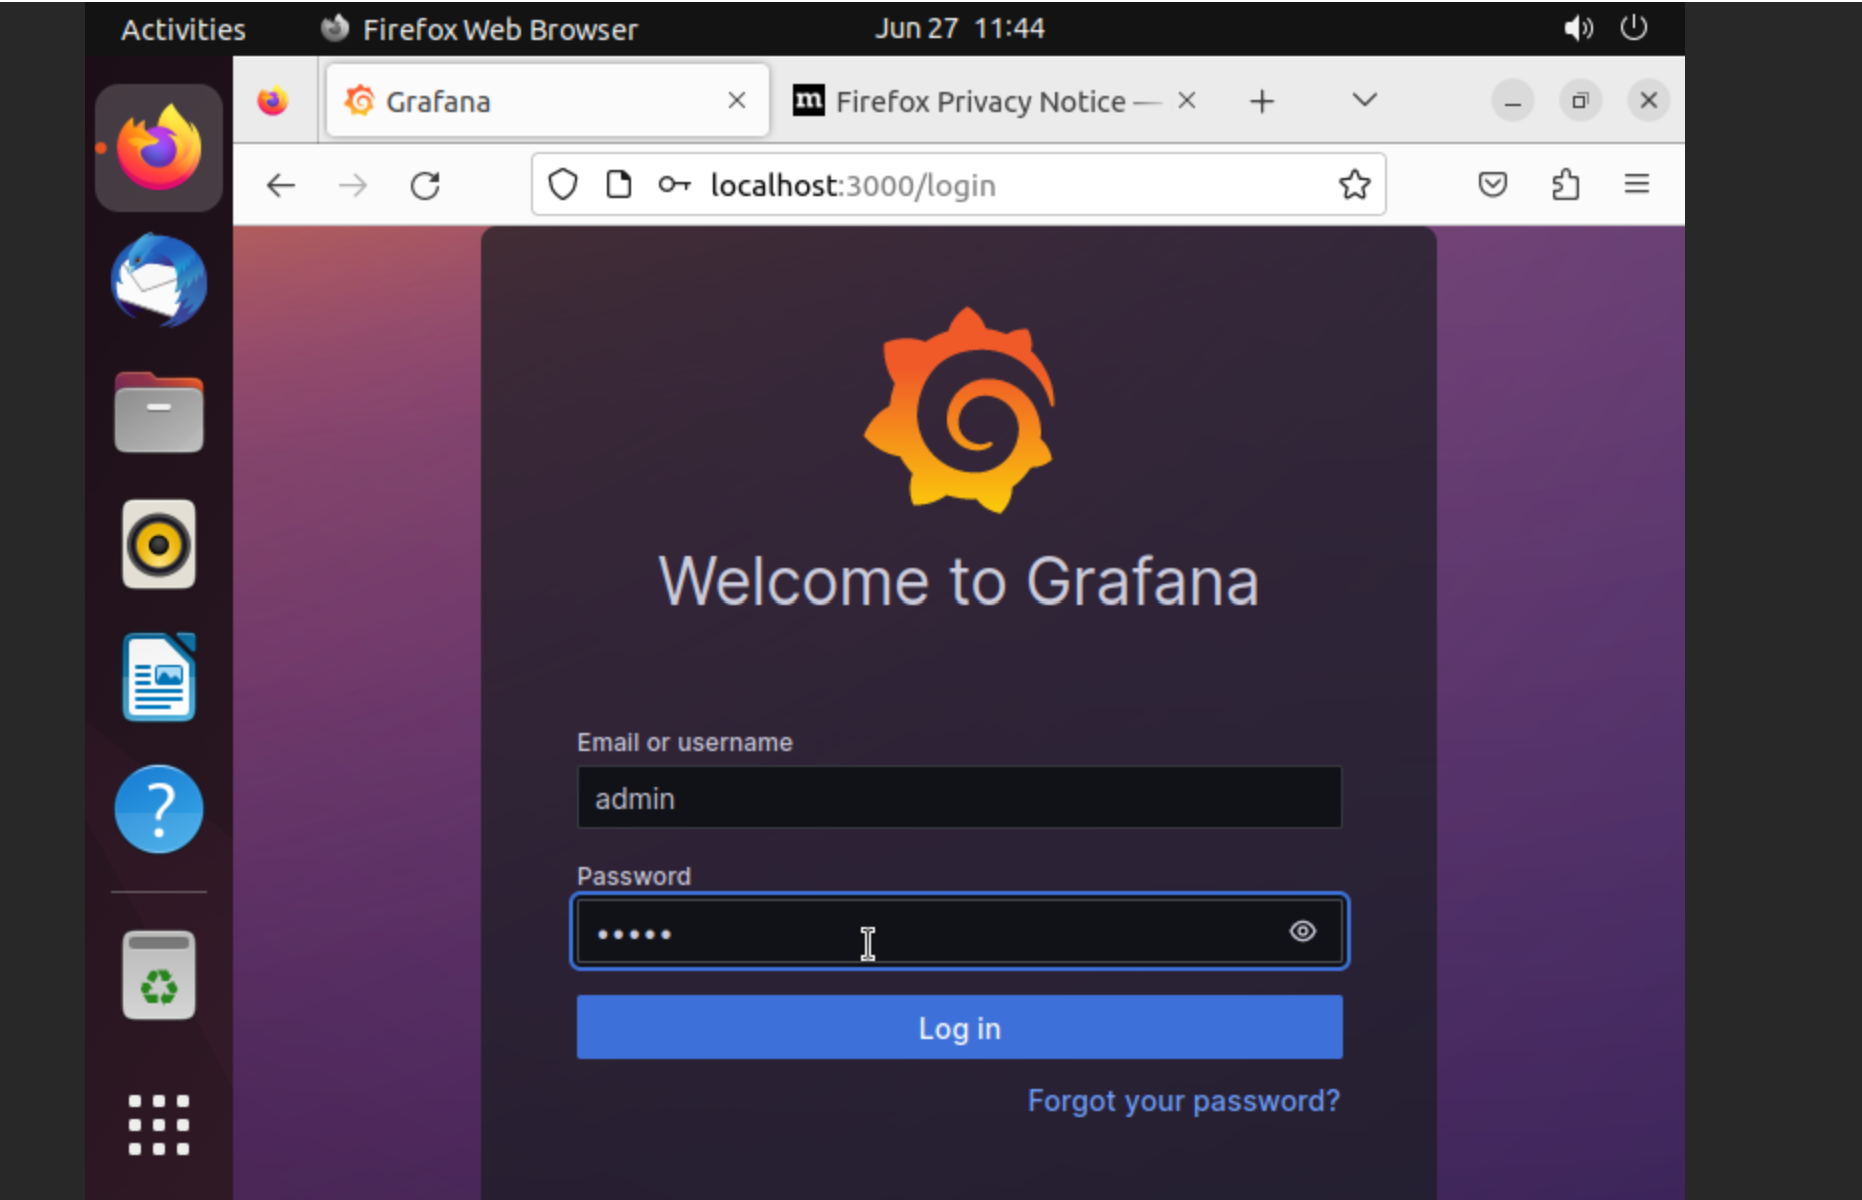
Go to the HTTP://localhost:3000 in the search bar. That URL open Graphana, type the login and password by the default settings Login:admin and Password:admin. Enter credentials:
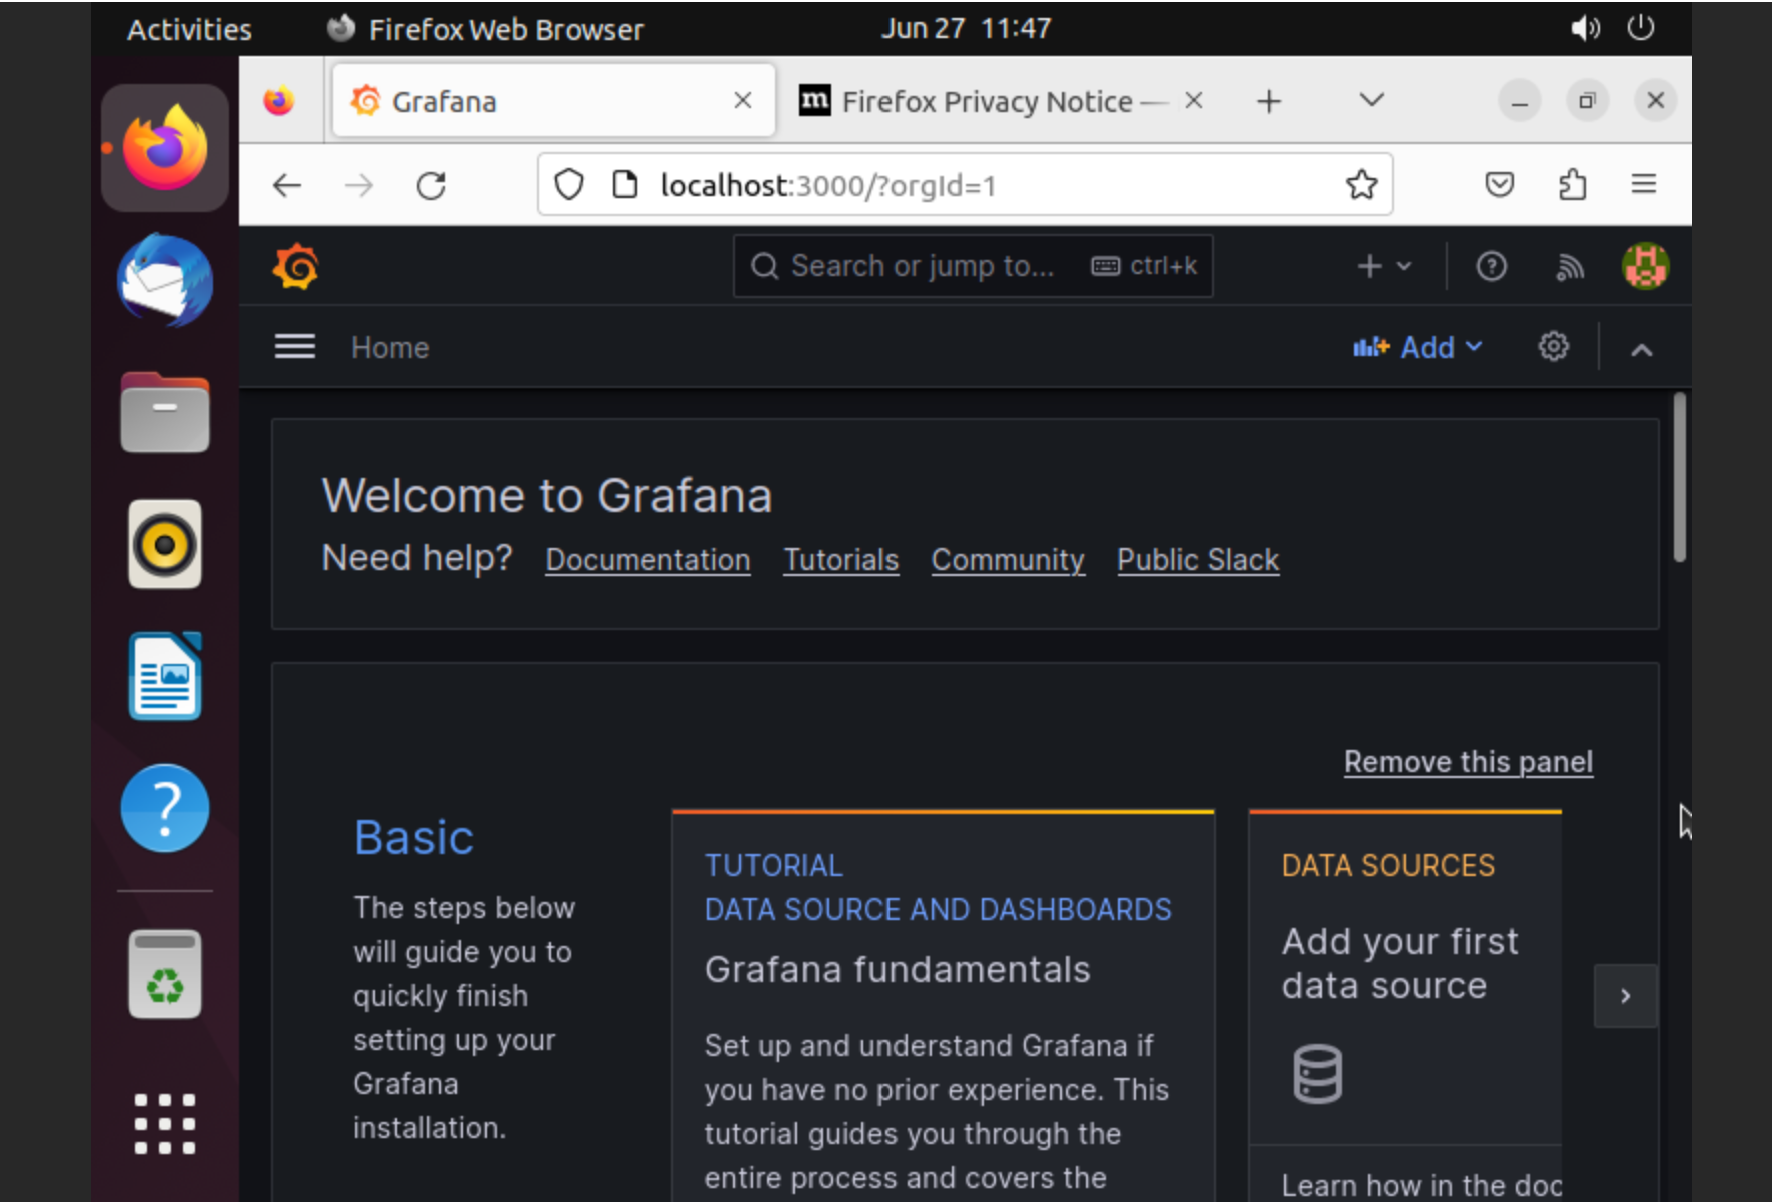
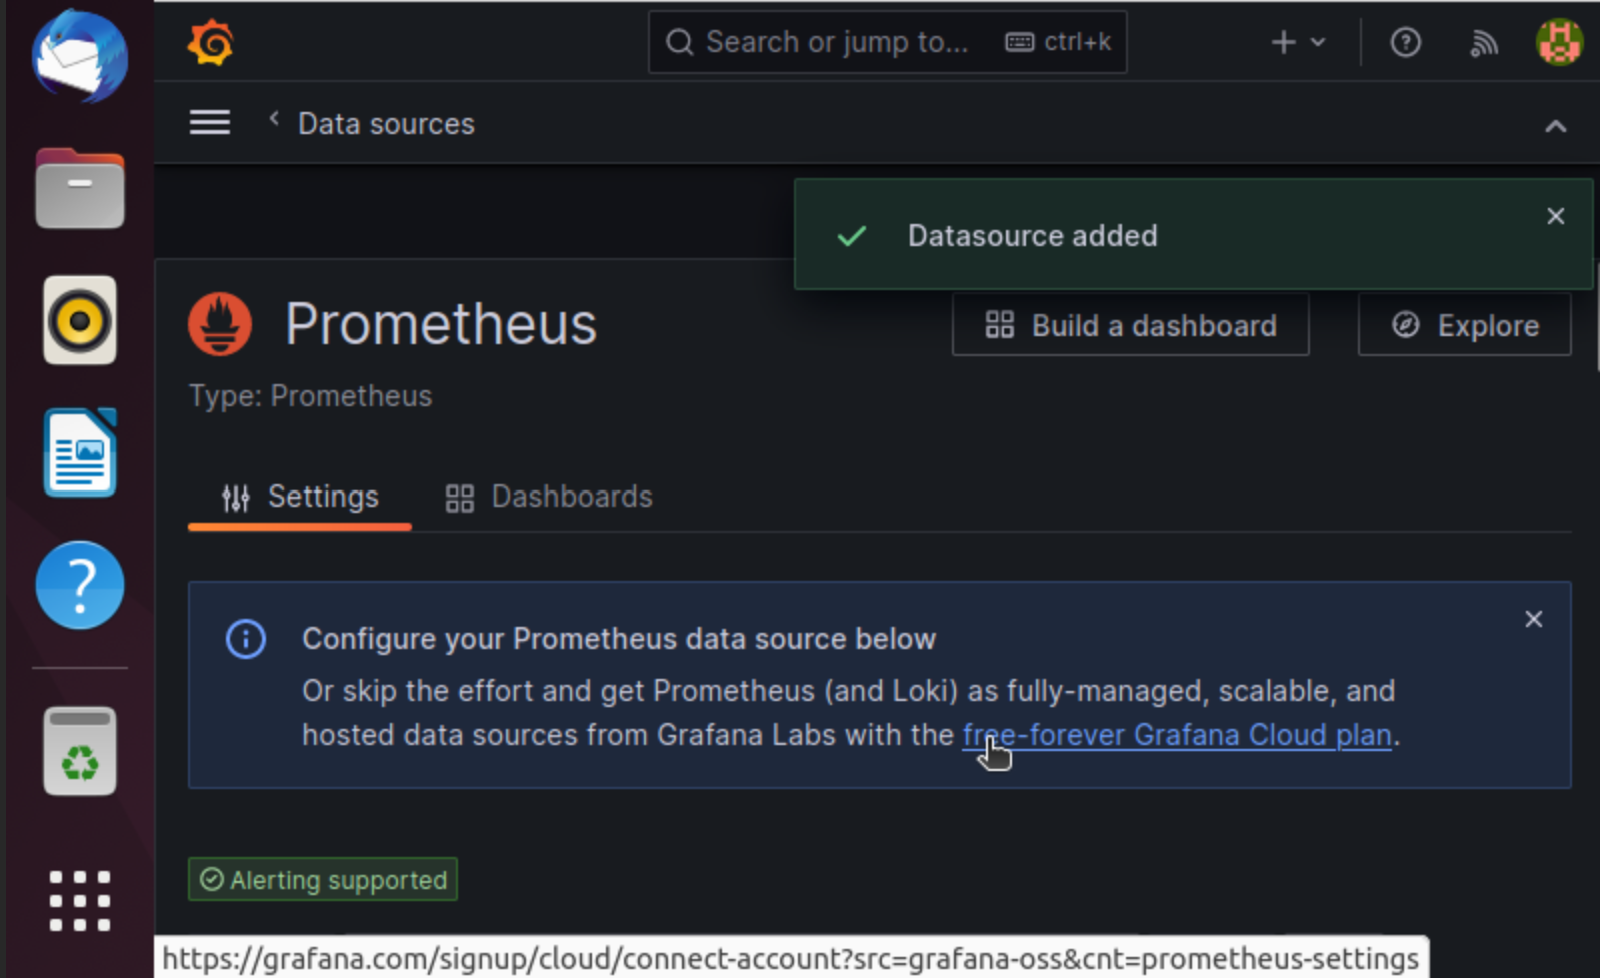
Okey, we are in. Go to the tab Administration and choose Add data, then you can enter URL for Prometheus http://localhost:9090:
Click for the button Add data source:
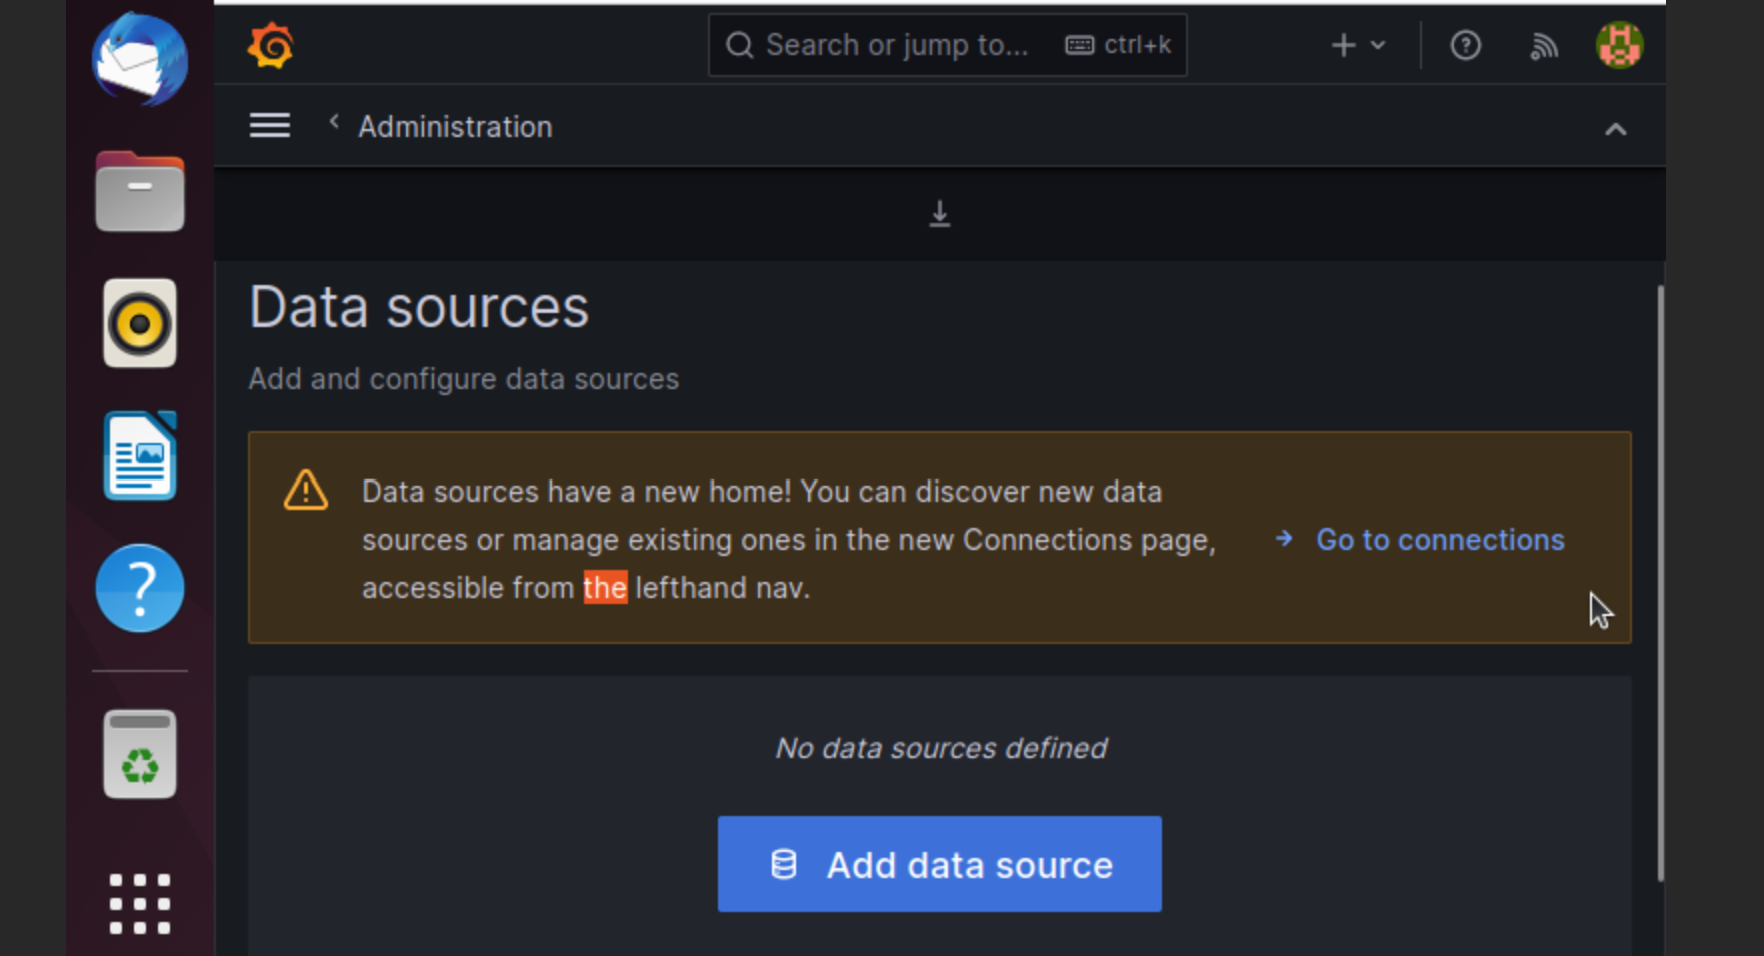
Check the message above this source and we get it! System was installed!
Conclusion
In conclusion, resource monitoring is crucial for the effective management of any system. By tracking resources such as CPU usage, bandwidth, and cost, organizations can optimize the performance of their IT systems and identify potential security threats. In this article, we looked at how to set up a resource monitoring system using tools such as Prometheus, MongoDB and Grafana. By following the instructions in this guide, you can easily install and use these tools to create an effective monitoring, alerting and visualization system for your organization. By installing the right system, you can ensure that your IT infrastructure works smoothly, reliably and with maximum efficiency.
FAQ - Frequently Asked Questions about Monitoring MongoDB with Grafana and Prometheus
- Q1: Why is resource monitoring important for MongoDB and servers in general?
Resource monitoring helps track key performance metrics like CPU, memory, disk I/O, and network usage. It allows early detection of bottlenecks, ensures system stability, prevents outages, and helps optimize resource allocation and costs. - Q2: What roles do Grafana and Prometheus play in this monitoring setup?
Prometheus collects and stores metrics from monitored services, including MongoDB. Grafana connects to Prometheus and provides an intuitive web interface for visualizing these metrics via dashboards and alerts. - Q3: Can I monitor MongoDB without using Docker containers?
Yes, you can install Prometheus, Grafana, and MongoDB exporters natively on your Ubuntu system, but using Docker simplifies deployment, isolation, and management. - Q4: How often does Prometheus collect data from MongoDB?
In the example configuration, Prometheus scrapes MongoDB metrics every 5 seconds, but you can adjust the scrape_interval in the prometheus.yml file according to your needs. - Q5: What are common issues to watch for when setting up this monitoring system?
Ensure correct network connectivity between containers or services, proper port exposure, and accurate configuration of targets in Prometheus. Also, secure access to Grafana dashboards to prevent unauthorized viewing. - Q6: How can monitoring help improve MongoDB performance?
By analyzing collected metrics, administrators can identify slow queries, high CPU or memory usage, connection spikes, or disk bottlenecks, enabling proactive tuning or scaling decisions. - Q7: Is it necessary to install a desktop environment on Ubuntu to run Grafana and Prometheus?
No, Grafana and Prometheus run as web services accessible via a browser. The desktop environment is optional if you prefer to interact locally rather than remotely.


