How to Use WinMTR to Diagnose Network Issues on Windows Server 2019
Download WinMTR first. To do this, follow the link https://sourceforge.net/projects/winmtr/ and click the “Download” button.
Unpack the downloaded archive to a convenient location, open the folder and run WinMTR.exe from the folder with the bitness corresponding to your operating system. For Windows Server 2019, this is x64. Accordingly, we will use a file from the WinMTR_x64 folder.
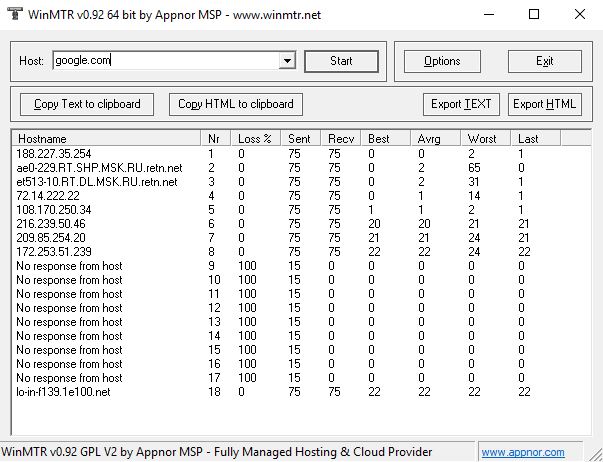
For a simple diagnostic of the network connection to a remote host, just enter its IP address or domain name in the Host field, and then click Start. All parameters can be left at default.
After that, you will see how WinMTR sends requests every second and which hosts network packets pass along the way. For better accuracy, we recommend waiting 1-2 minutes for some statistics to accumulate. Results can be sent to a technician or support team for analysis. For the convenience of exporting, there are buttons that allow both copying data and creating a text or html document.

Explanation of column names:
- Hostname - the name of the intermediate host. If you uncheck the “Resolve names” checkbox in the settings, then only the IP addresses of the nodes will be displayed.
- Nr - the number of the host in the route.
- Loss% - the ratio of lost and sent packets as a percentage.
- Sent - the number of sent packets.
- Recv - the number of responses received.
- Best - shortest response time after sending the request.
- Avrg - average response time after sending the request.
- Worst - longest response time after sending the request.
- Last - response time after sending the last request.
Conclusion
WinMTR is a simple yet powerful tool for diagnosing network connectivity issues on Windows Server 2019. By combining the functionality of classic command-line utilities like ping and traceroute with an intuitive graphical interface, WinMTR makes it easy to detect packet loss, latency spikes, and routing problems. Whether you're troubleshooting internally or preparing a report for technical support, this tool provides clear and actionable data to help identify and resolve network issues efficiently.
FAQ
- Q: What is WinMTR used for?
A: WinMTR is a network diagnostic tool that helps identify packet loss, high latency, and routing issues between your system and a remote host. It's useful for troubleshooting connectivity problems. - Q: Do I need to install WinMTR?
A: No installation is required. WinMTR runs as a portable executable after you extract it from the downloaded archive. - Q: How long should I run WinMTR to get reliable results?
A: It's recommended to let it run for at least 1–2 minutes to collect enough data for meaningful statistics. - Q: Can I export the results from WinMTR?
A: Yes, WinMTR allows you to copy results to the clipboard or export them as text or HTML files, which is useful for sharing diagnostics with support teams. - Q: Is WinMTR compatible with all versions of Windows Server?
A: Yes, WinMTR works on most modern Windows systems, including Windows Server 2019. Just make sure to use the correct version (x64 or x86) for your system architecture.
 700
300
 700
300
 700
300


