Serverspace has implemented Kubernetes Dashboard
Cloud provider Serverspace has implemented a new option in Kubernetes service, Dashboard. This is a standard web interface where you can deploy containerized applications, manage cluster resources and monitor their performance. Users can now access Dashboard directly via the Serverspace control panel.
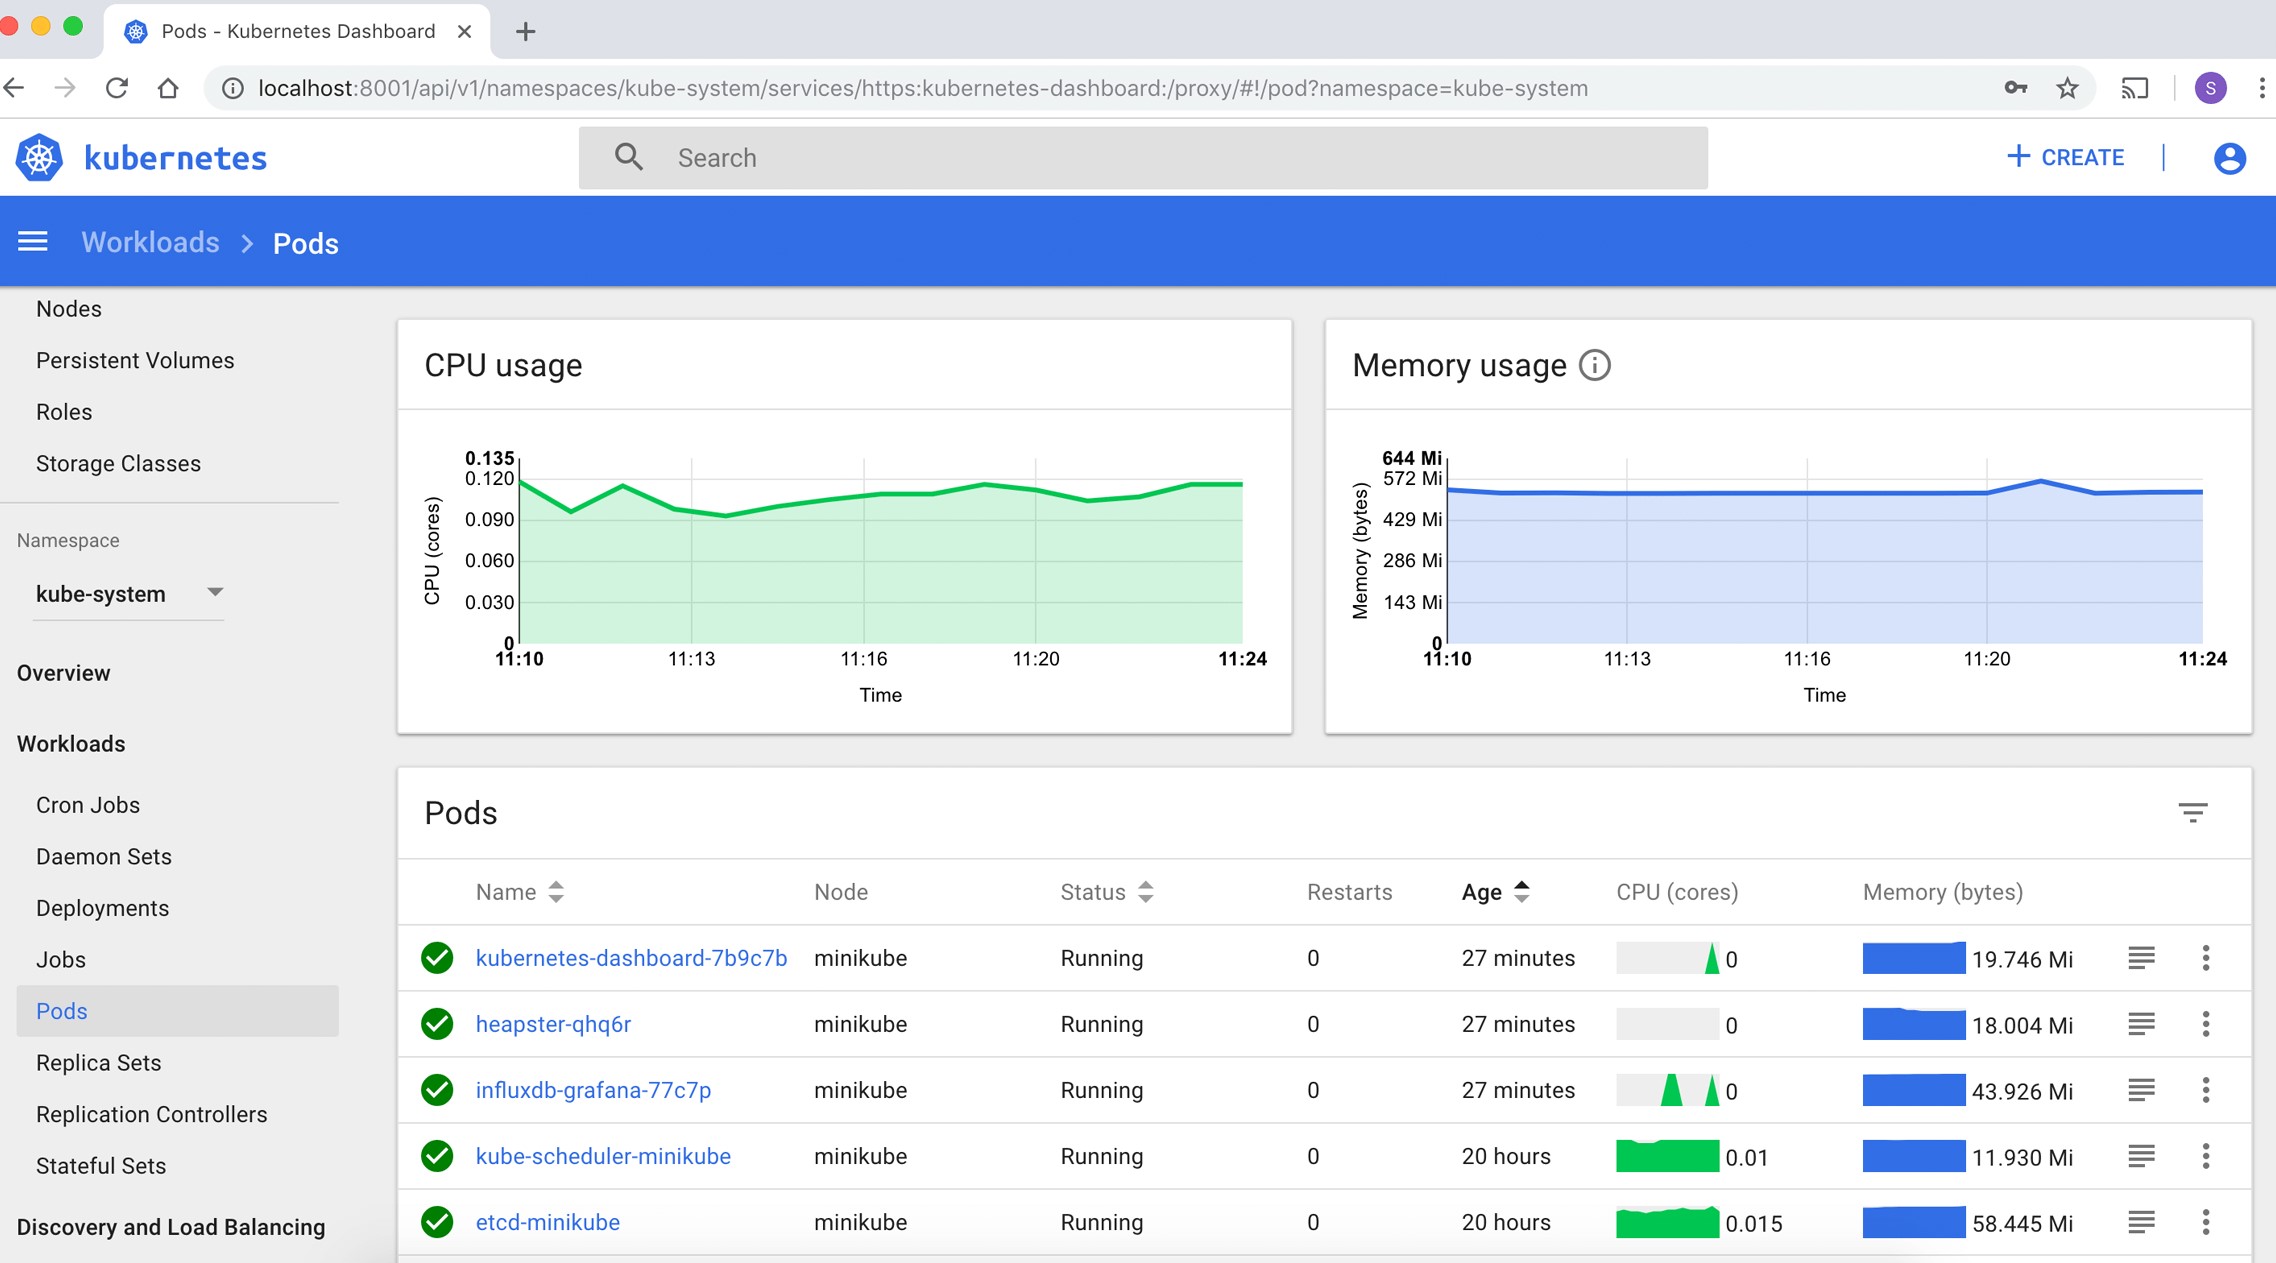
What features are available in Kubernetes Dashboard?
- Deploy containerised applications, initiate sequential updates and restart modules;
- Scale applications in a cluster;
- Monitor the status of resources in a cluster;
- Receive information on errors - the dashboard provides detailed logs, metrics and reports;
- Edit and manage ConfigMap and secrets hidden by default;
- View the logs;
- Access the CLI in containers.
You can find all the features of Dashboard in the Kubernetes documentation.
How to connect to Dashboard?
To access the Kubernetes web interface, you need to sign up in the control panel, create a cluster and connect using the domain name and token that will appear in the details. To do this:
- go to Kubernetes tab in the control panel;
- select the data centre and cluster resources required;
- Note: you must select an ingress controller (nginx) on at least one node group to install Dashboard.
- go to the cluster details;
- copy the token and click on the Dashboard Address;
- select connection via Token and paste the copied value in a new tab;
- press the "Sign in" button.
Note: to access the Dashboard for projects with already created Kubernetes service, you need to upgrade it to version 1.25.6.