In an operating system, there are many monitoring mechanisms, data collection mechanisms that allow you to track the state of viability of key components, security and performance. In a large information and computing network, the collection of this type of data is a necessity for timely response to various kinds of events and incidents.

Architecturally this task can be realized in different ways, in Linux there is a low-level BPF kernel mechanism that allows to implement arbitrary code in privileged space. It is used by Snort/Suricata modules to filter passing traffic, tcpdump to remove it before it gets to the TCP/IP stack. Let's consider the algorithm of work and the main advantages of this solution!
What are BPF and eBPF?
BPF or Berkley Packet Filter is a virtual machine inside the OS kernel, which allows you to load arbitrary code into it. The algorithm of this solution is tied to system events. Any BPF program will be launched only after the event to which it is bound occurs.
Programs are usually written in C language using special libraries and header files provided by LLVM project and eBPF community. The file is then compiled into a program.o file and loaded into the kernel via the bpf() system call.
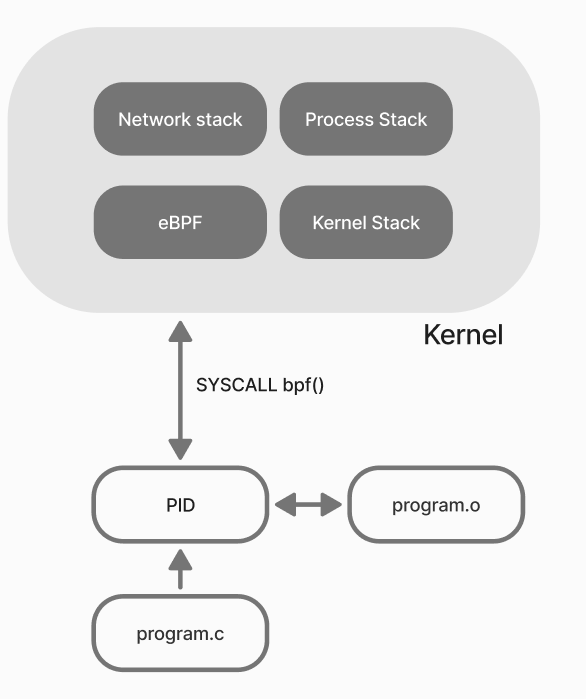
It is important to emphasize that the main purpose of a BPF program is monitoring and tracing, input/output data from library/application functions and tracing system hooks. For collecting statistics, performance evaluation, development of security subsystems.
Its extended version is eBPF, which has similar functionality, however, it is presented in later versions of the kernel.
How do programs and bpf-objects work?
Let's preinstall the necessary tools that will allow us to form system calls in relation to the bpf stack. To do this, enter the command into the line:
dnf install bpftool bpftrace -y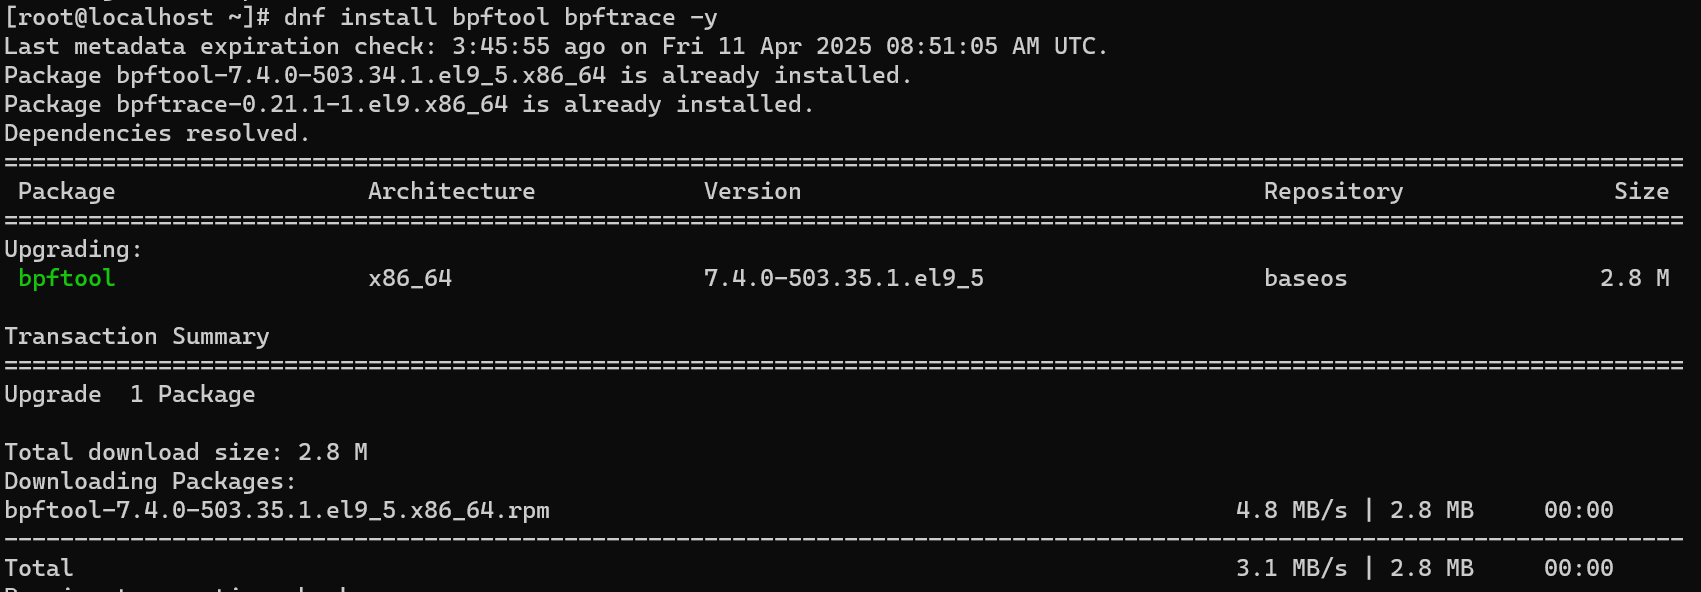
After reviewing the functionality and syntax of the tool available to us:
bpftool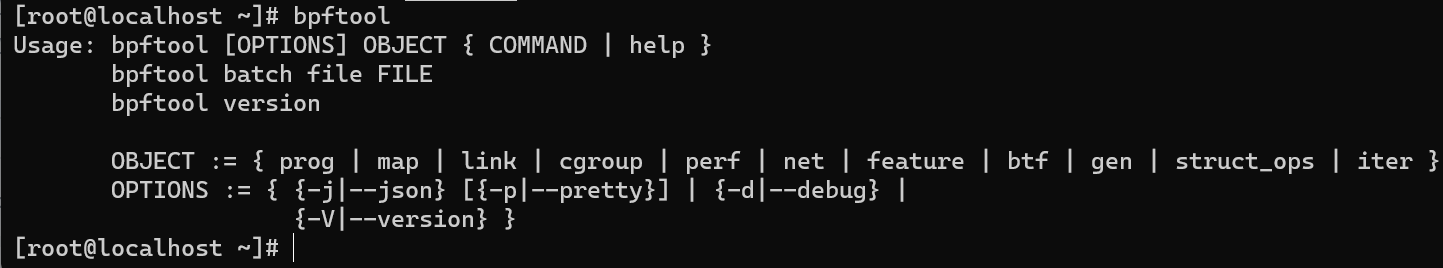
Management of objects such as BPF programs, BPF maps, links and net is available.
BPF programs
Several types of programs with different mechanisms are used for monitoring and tracing:
- uprobe - allows you to create breakpoints in any user-space process, without changing the source code;
- kprobe - used to trace events in the kernel and modules, does not require special breakpoints in the code;
- tracepoints - used to track events in the kernel and modules, requires special points in the code;
- perf_event - allows collecting various metrics such as function execution time, resource usage (CPU, memory, etc.) and analyzing them for performance optimization.
Let's take a closer look at the mechanism in a practical example of monitoring the user authentication process. We will use uprobe, which will allow us to attach to a library function and read the data being transferred. Let's look through the full path to sshd:
nano /usr/lib/systemd/system/system/sshd.service 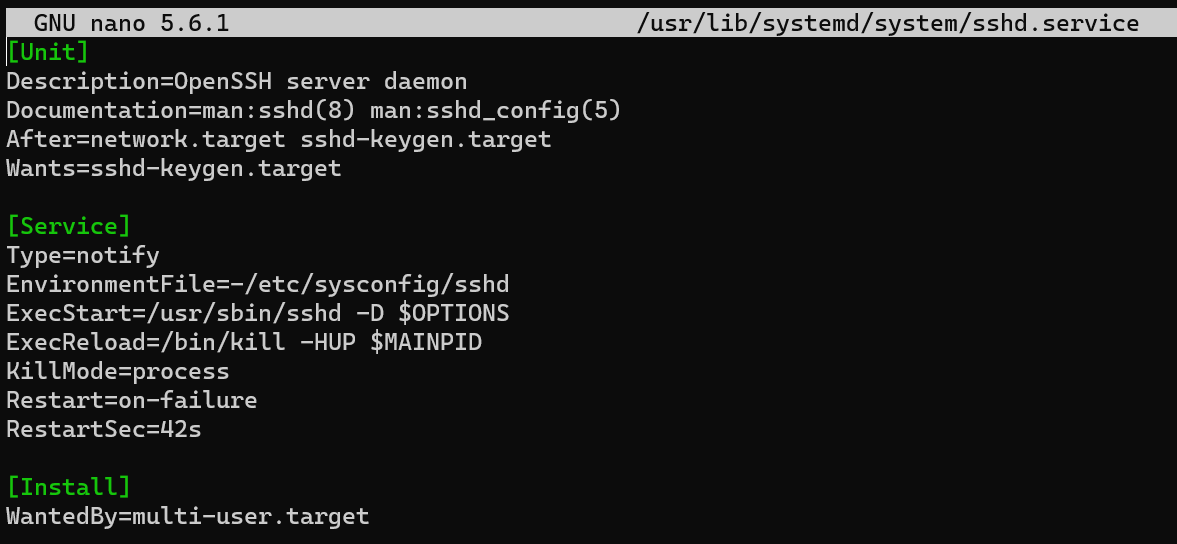
For the daemon let's find the libraries it loads, classically many solutions use PAM in Linux:
ldd /usr/sbin/sshd 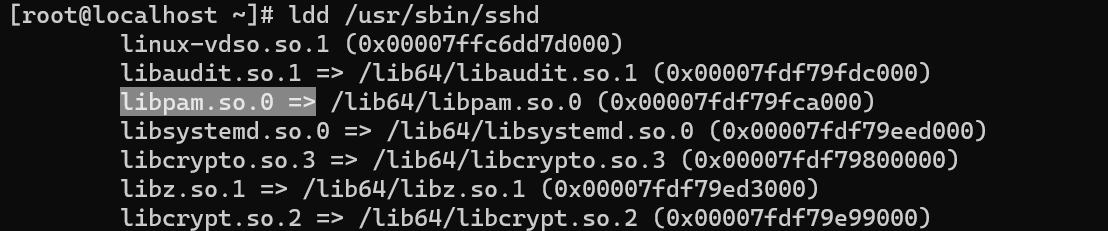
PAM is also present in sshd, so we will use it to dump creds. Let's look at the internal functions that may contain the authentication process:
readelf -Ws /lib64/libpam.so.0 | grep auth 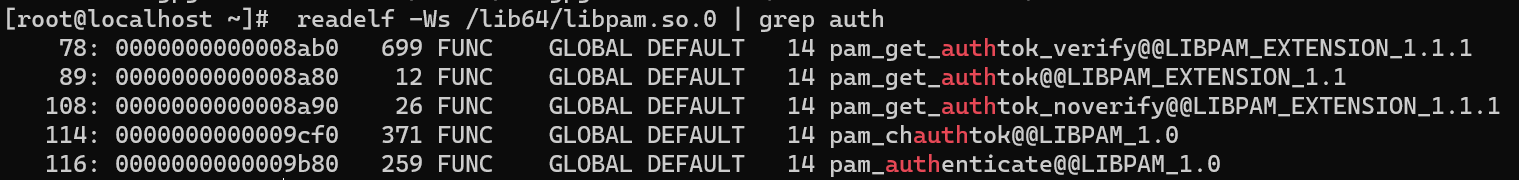
Among the presented functions, the interesting one is pam_get_authtok, which works with the user token. Let's use bpftrace to load the program and check the correctness of the found function:
bpftrace -e 'uprobe:/lib64/libpam.so.0:pam_get_authtok { printf(“target call execute\n”); }' 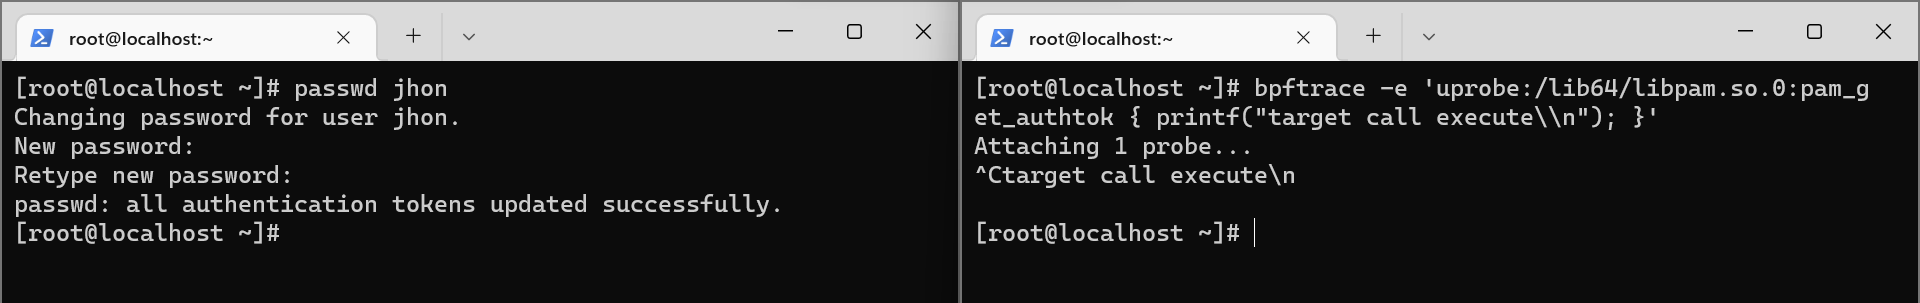
Great, the BPF program executed because the pam_get_authtok function was called and its context was available! Which means that the program could dump the creds from the function and put them into the storage.
BPF maps
Here they are called BPF-maps, they store all data in the form key:value. You can view them with the command:
bpftool map show 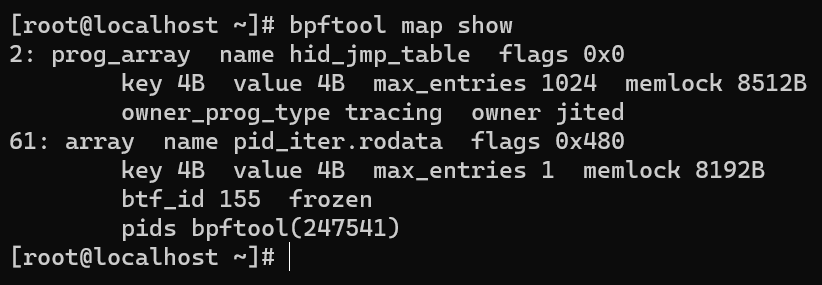
And after the PID can use a system call to access the cells and export the creds! Also different BPF programs can communicate with maps. Therefore it is important to realize that access to this kind of mechanisms should be restricted for normal users.
Link objects
Communication between a program and a monitoring point is possible thanks to the Link object, you can view the existing links between programs and monitoring points with the command:
bpftool link show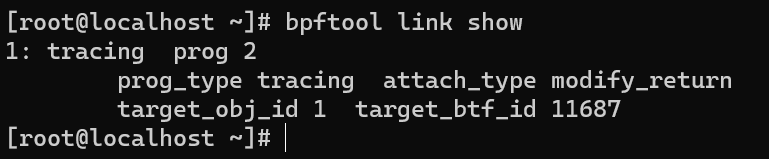
Attach type indicates that the values can be modified by the program during transmission, and tracing prog 2 indicates that the trace belongs to the program with id 2. Let's view it with the command:
bpftools prog show id 2 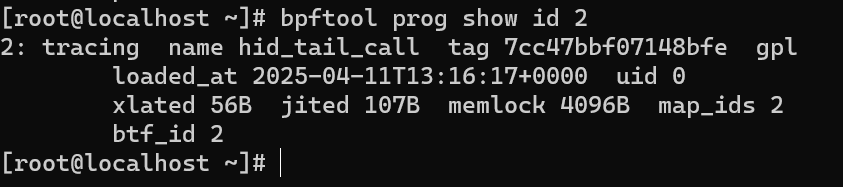
Presumably it modifies requests from the Human Interface Device, it can be dumped with the command:
bpftool dump xlated id 2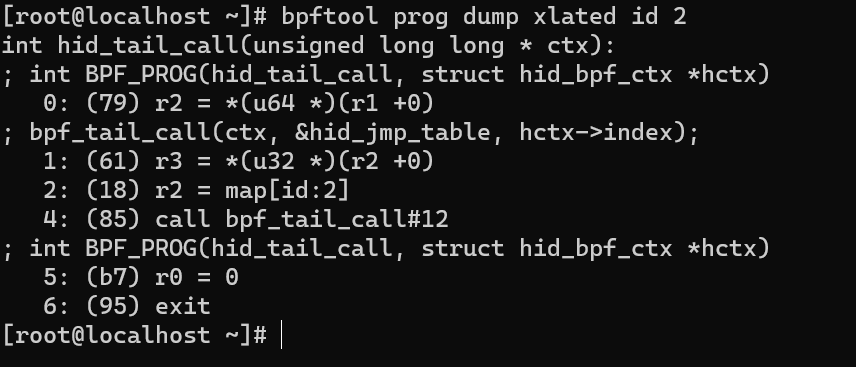
As a result, we get the disassembled instructions used in the program. This kind of analysis is useful for finding malicious solutions and understanding the operation of low-level monitoring mechanisms such as tcpdump and others!
FAQ: BPF and eBPF in Linux
- Q1: What is BPF in Linux?
A1: BPF (Berkeley Packet Filter) is a kernel-level virtual machine that allows you to run custom programs triggered by system events. It is primarily used for monitoring, tracing, and collecting statistics on system performance and security. - Q2: What is the difference between BPF and eBPF?
A2: eBPF (extended BPF) is an enhanced version of BPF available in modern Linux kernels. It offers more features, greater flexibility, and can safely execute programs in the kernel without compromising stability. - Q3: How do BPF programs work?
A3: BPF programs are usually written in C and compiled into .o files. They are loaded into the kernel via the bpf() system call. Programs execute only when a specific event occurs, such as a system call, kernel function call, or user-space process event. - Q4: What are the main types of BPF programs?
A4: Common types include:
uprobe - attaches to user-space functions without modifying source code
kprobe - traces kernel functions and modules
tracepoints - tracks events at predefined points in kernel code
perf_event - collects performance metrics like CPU and memory usage - Q5: What are BPF maps and links?
A5: BPF maps store data in key-value format, enabling communication between BPF programs. Link objects connect BPF programs to monitoring points, controlling how programs read and modify traced data. - Q6: What are practical use cases of BPF/eBPF?
A6: BPF is used in tools like tcpdump, Snort, and Suricata for traffic filtering, monitoring system calls, analyzing performance, and building security solutions. It allows precise data collection without modifying system behavior. - Q7: Is BPF safe to use as a regular user?
A7: Access to BPF mechanisms should be restricted. Improper use may expose sensitive data or affect system stability. Administrative privileges are typically required to load and manage BPF programs.


