
Imagine the situation – required software is installed and configured. This software communicates with servers in network (any web application sending requests to remote DB, network backup system etc.). Until some moment everything is working correctly with no any delays but suddenly either it is starting to work slowly or even stop to work. How to understand on which server the problem occurred? On which point of traffic transmission delays or restrictions appeared?
Ping utility can help to clear out if remote server is accessible, but further diagnostics will require other tools. One of these is Traceroute – utility that is capable to perform network connections tracing. Traceroute shows nodes (routers) the packet passes through and how long it takes to process the packet at each node.
The utility is often coming preinstalled and can be used at any moment. If it’s not available for any reason than it can be installed from standard distribution repository by means of packets manager:
-
- for deb-based distribution:
sudo apt install traceroute-
- for rpm-based distribution:
sudo yum install traceroute
How traceroute works
The utility tracks the nodes on which network packet coming during its transmission to the target host. UDP protocol is used by default – UDP datagram is created and packed into IP packet. In one of the packets headers traceroute sets the value of TTL (Time To Live) parameter to 1. This parameter is used to limit the number of transitions from one router to another, i.e., it allows avoiding infinite packet transmission between routers (for example, in the case of incorrectly configured dynamic routing protocol, or errors in static routes). Each router receiving a packet reduces the TTL value by 1 before sending it further to the network. In a situation where next TTL decrease becomes equal to 0, the packet is considered undelivered and discarded, while the router responds to the sender with an error message.
Thus, with TTL = 1 traceroute receiving a response from the first router determines its IP address and the time spent processing the packet. After that TTL is incremented by one to determine the next router, and so on until the packet hits the target host. The utility uses the specified IP address (or name) and port 34434 by default. The target host receives the packet and sends an error about the unavailability of port 34434 (because in most cases it is not used by any service and is closed). As a result, the entire packet chain is tracked which ends with a response from the target host.
A router is any device that transmits a packet from one subnet to another —not necessary a specialized network device but any network server. This is especially important for micro-service architecture of applications using containerization technologies. Analyzing the time spent on the transition from one router to another you can try to determine on which of them delays are appearing - perhaps due to a lack of resources on one of the servers, or due to a malfunction of the disk system, etc. The packet will not reach a target host if one of the servers is unavailable, and the utility will determine at what point of the transfer this happens. Also, the packet will not reach if traffic filtering is in effect (meaning interfering with the transmission of the packet).
Traceroute launch
The name of the target host or IP address is mandatory for the utility:
traceroute linux.orgOutput:
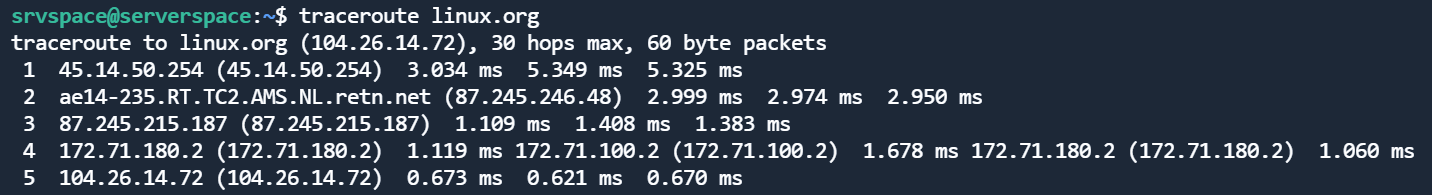
What data gathered by the utility and are shown in the table:
- it took 5 transitions (hops), this value is in the first column;
- IP address and name (if available) of next router is determined on every hop;
- time (RTT - Round Trip Time) spent on sending and receiving a request from the router.
Traceroute sends three UDP packets by default, so three RTT values are displayed in the output. For the first line it is 3.034 ms, 5.349 ms, 5.325 ms. Another default value is the number of hops a packet can go through, i.e., TTL = 30. An arbitrary value, for example 35, can be specified in the command line with the option " -m 35 ". On some hops more than one router may be defined – this is due to the presence of multiple routes at this point. By sending three UDP packets at once the response can come from three different routers, and RTT is also specified for each. An example of such a response on the fourth hop: IP 172.71.180.2 and 172.71.100.2 are determined through which packets can be delivered to the target host.
It is necessary to pay attention to hops with high RTT – this means that the router takes a long time to process the packet, and the reason for such a delay has to be found.
It is worth noting that the response may come to the sender by another route due to the presence of an alternative route or the use of load balancing technologies. If there is a high RTT on some hop then you should run the utility again and check the result.
Also, packet filters may be in effect on one of the routers, or it can be a specialized firewall device. In this case there could be restrictions for the port or UDP protocol, and three asterisks will be displayed in the traceroute output (i.e., the response timeout has been exceeded):
traceroute mongodb.org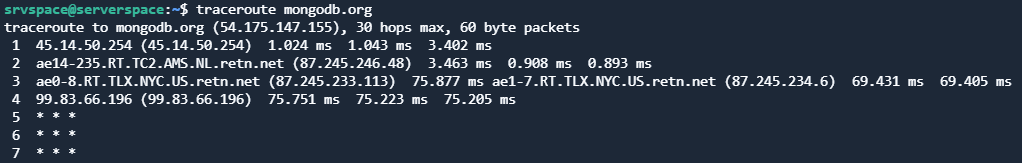
Resource mongodb.com available but UDP packets are filtered.
Traceroute can use ICMP protocol instead of UDP – one "Echo Request" request is sent, ICMP messages are also received in response, no any port is used. For the rest there is no different. The " -I " option in the command line for ICMP tracing:
traceroute mongodb.org -I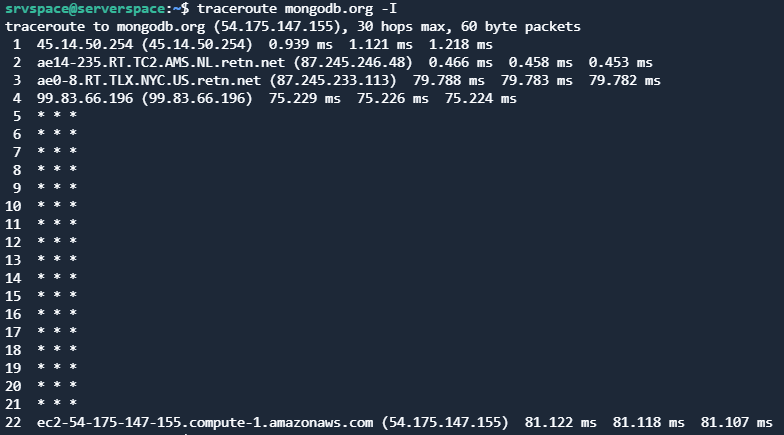
It can be seen the response was received from the target host although no responses between 5 and 21 hops.
TCP protocol can also be used (option " -T") – in this case SYN requests are sent to port 80.
Useful options of traceroute:
- "-4" and "-6", specifying IPv4 and IPv6 protocols respectively;
- "-I", specifying network interface, e.g., "-i ens0s5";
- "-n", disabling name resolution;
- "-p", specifying custom port (for UDP and TCP);
- "-m", maximum number of transitions (hops).
Network tracing in Windows
Tracert is the utility available in Windows OS to trace network connections similar to Traceroute in Linux.
This utility uses ICPM protocol only, has fewer options and working the same way as traceroute.
Conclusion
Traceroute is a convenient tool for diagnosing network connections, helping to determine at which node there are delays or restrictions for traffic transmission. At the same time, it is not always easy to interpret the results of its work due to filtering rules, redirection systems and traffic balancing. To diagnose a distributed application, a clear understanding of the architecture used is required. Combining the available options is also useful for diagnosing external resources.


