Previous episode
In the previous episode of the series instruction, we consider the first steps for making a security—based system that can oppose DDoS attacks and prepare our system for this state. In brief, we install sniffing and monitoring software to our proxy server that collected for us data and put it in a special folder in the format file “.pcap”. Now we use this traffic for analysis and filtering mode that can help forensics specialists and pentester in their job. Let’s get started!

Software
In wireshark, we have filtering options which can be very useful for creating a normal traffic profile. Port, protocol, IP address and expression filter isolate the traffic and can create a list of needed information. We can import this data to Excel or anything comfortable software for working with traffic.
Analysis
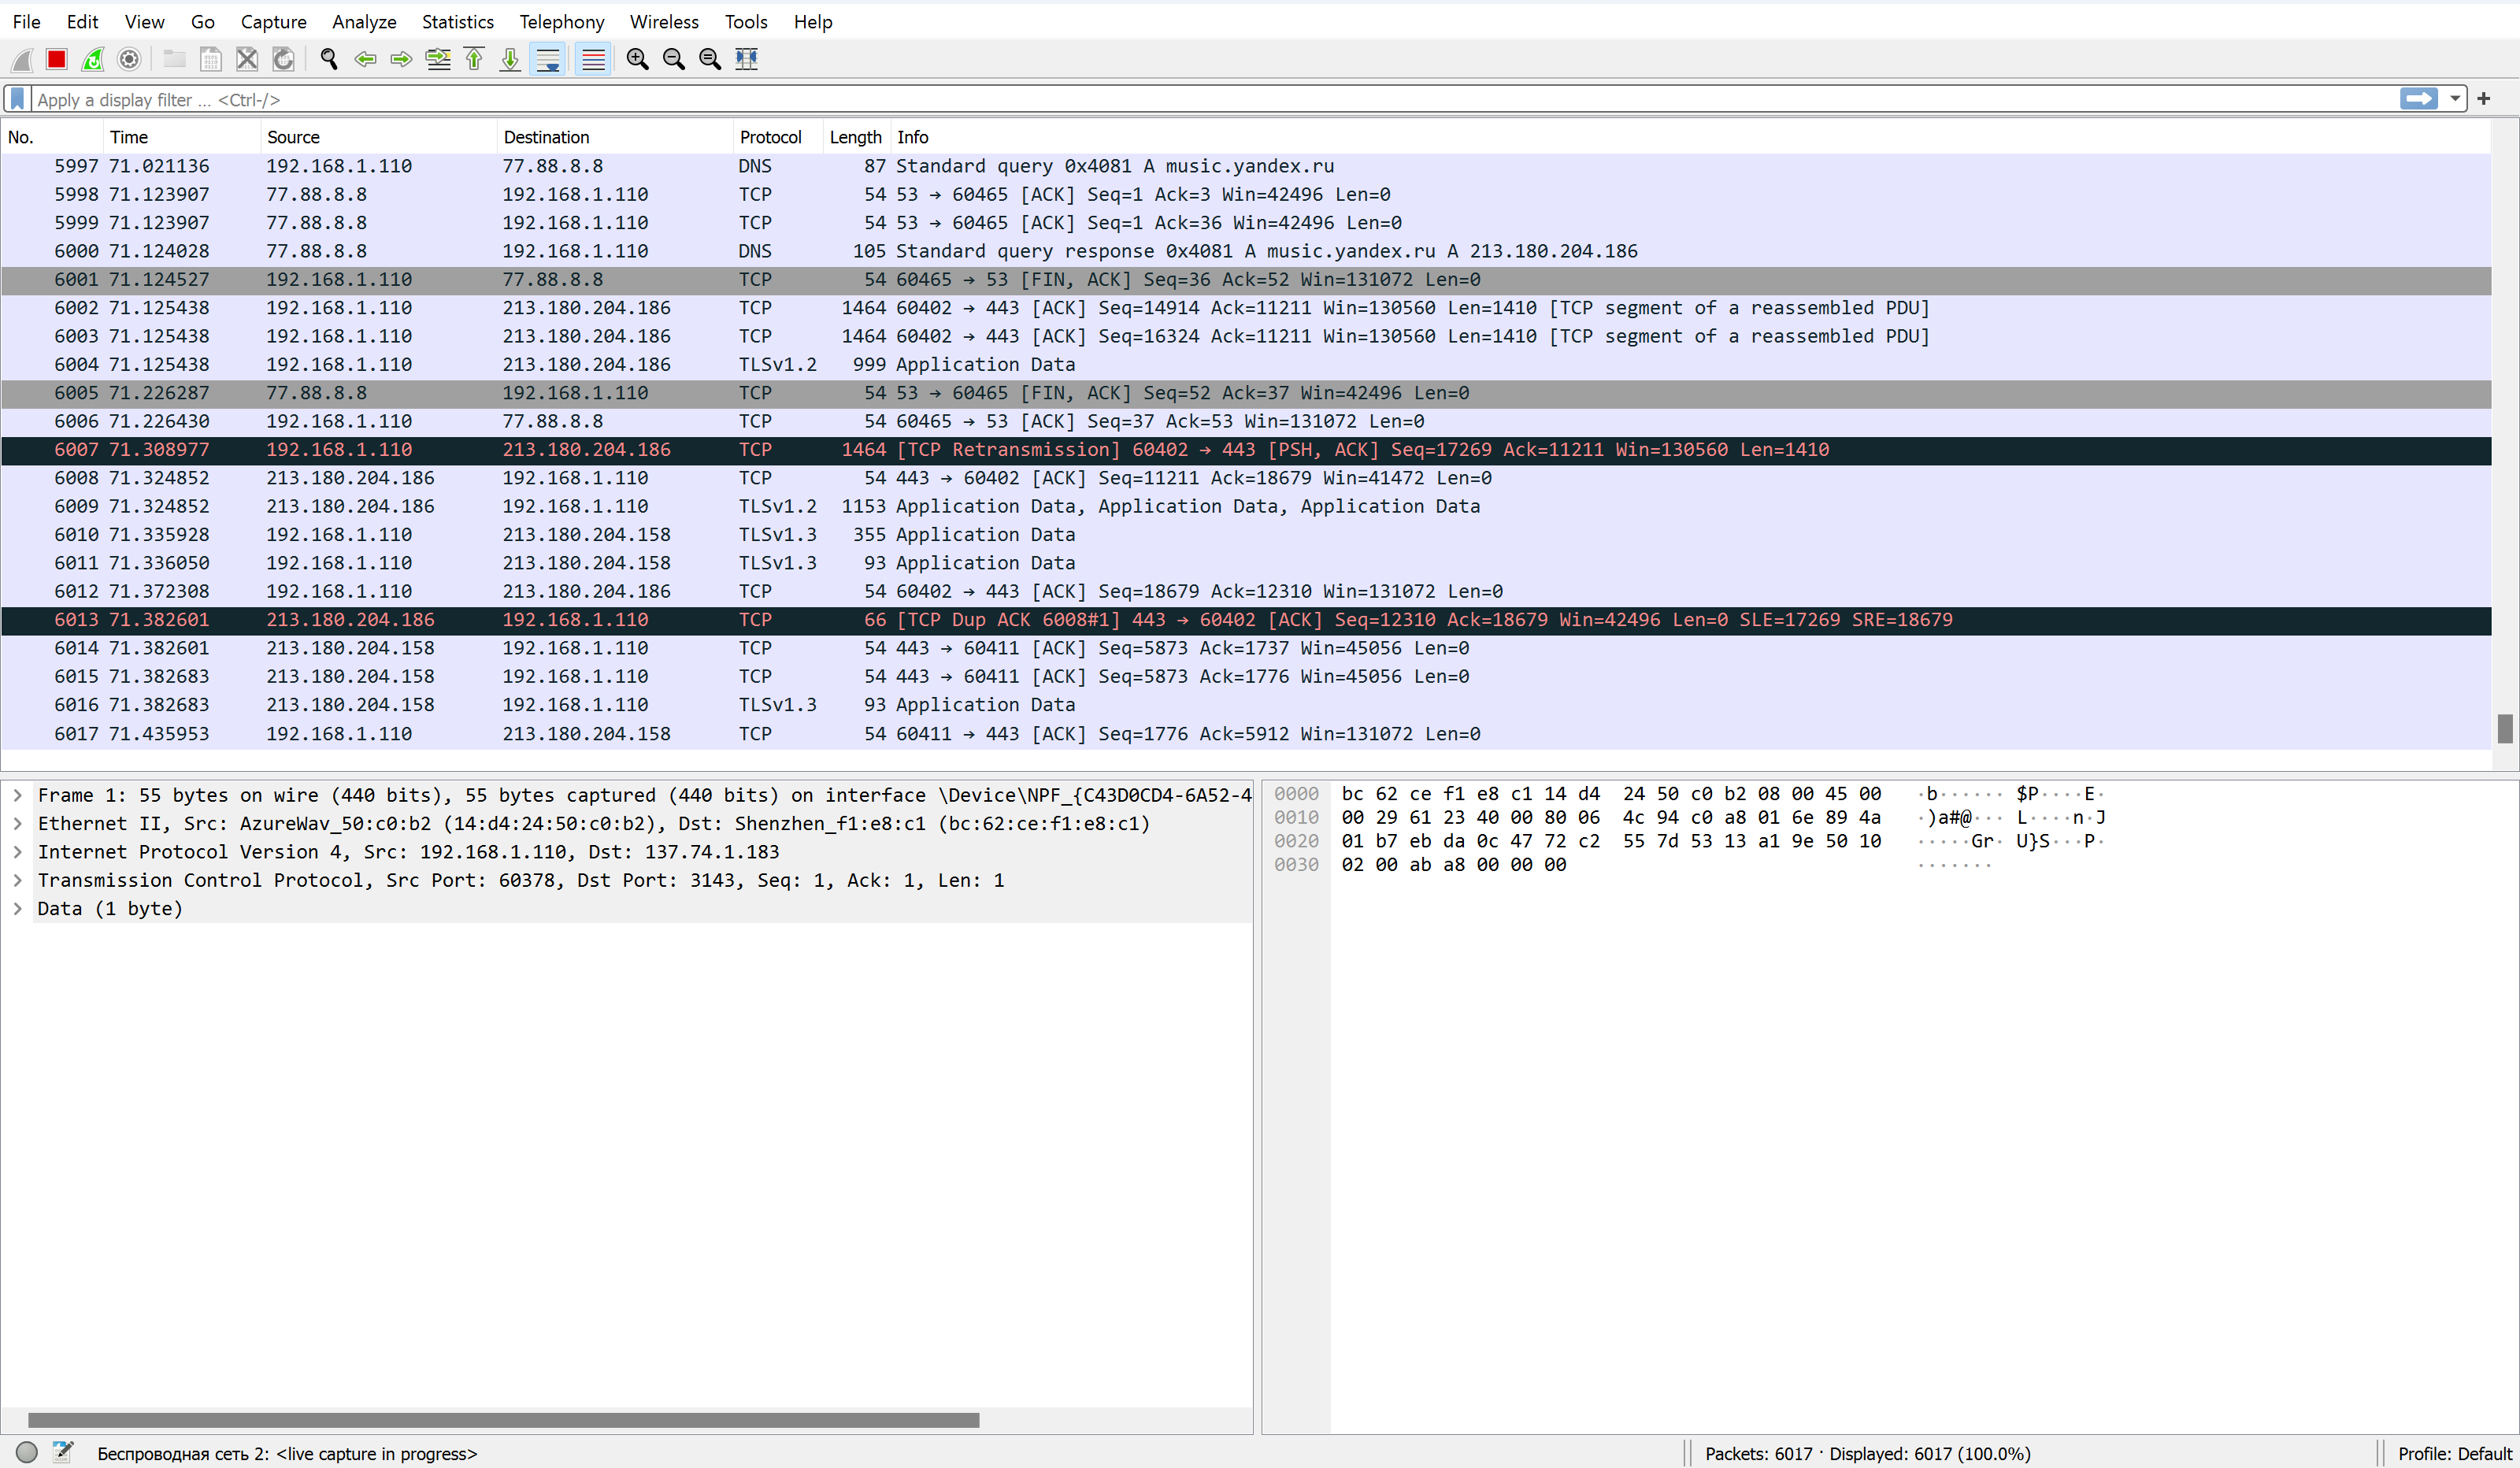
Consider the main window of the monitoring program:
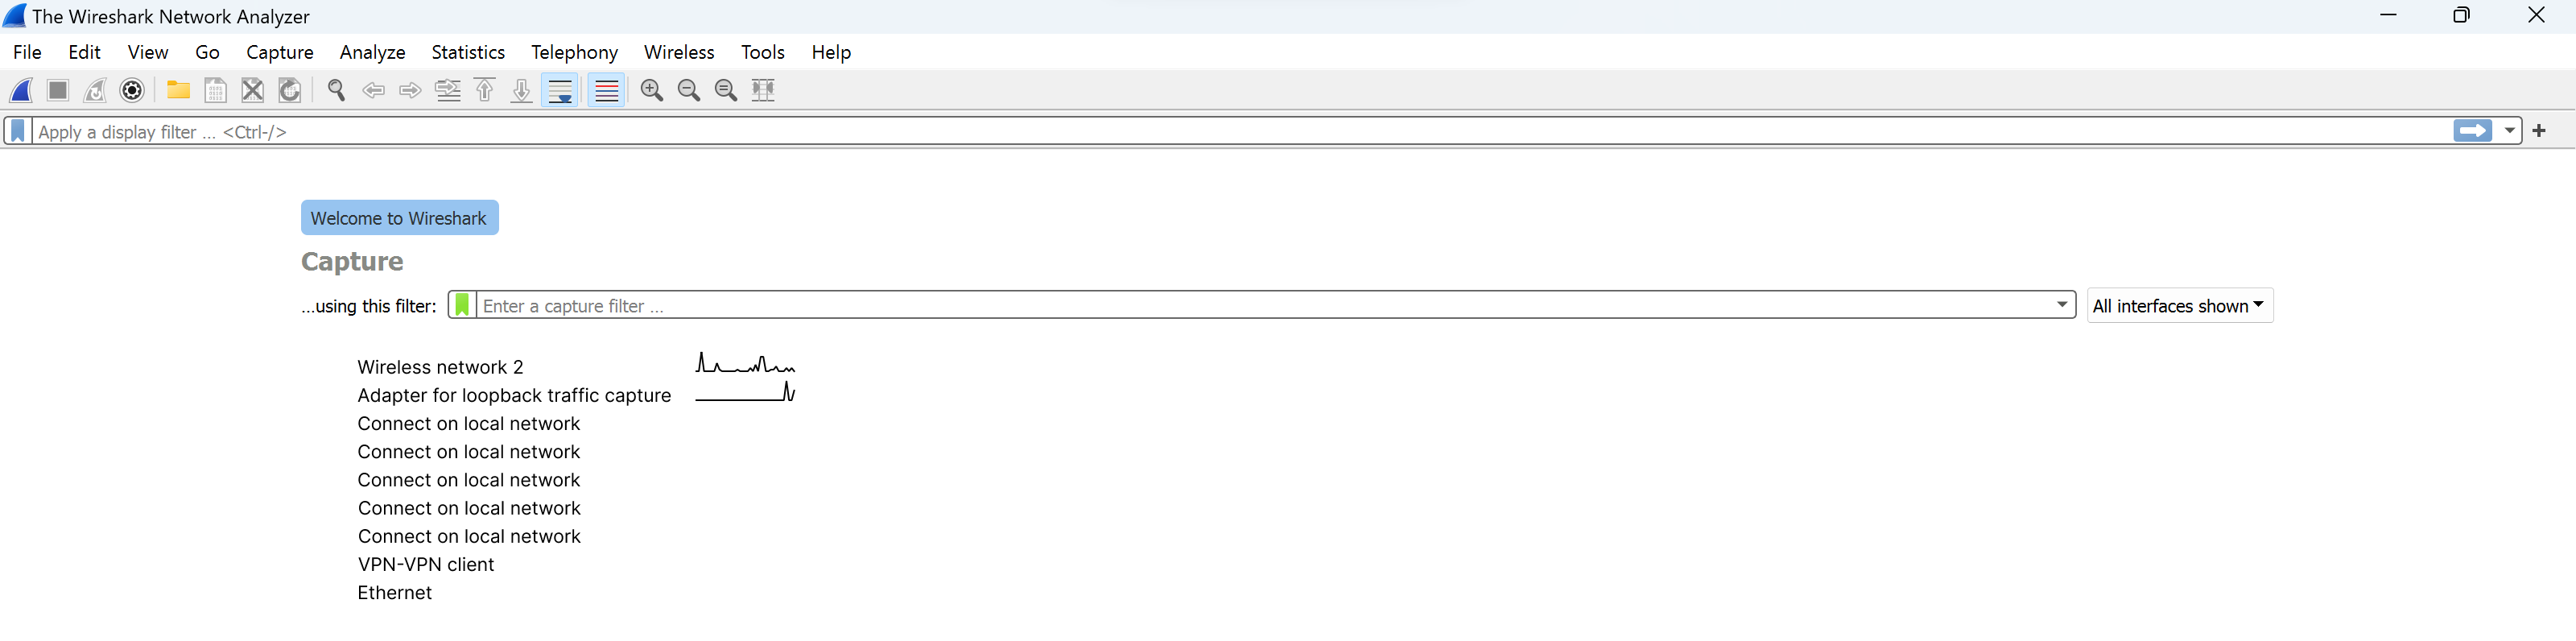
If you miss the previous episode you need to collect a certain amount of traffic in our program this is also possible. Click on a button resembling a shark's crest:
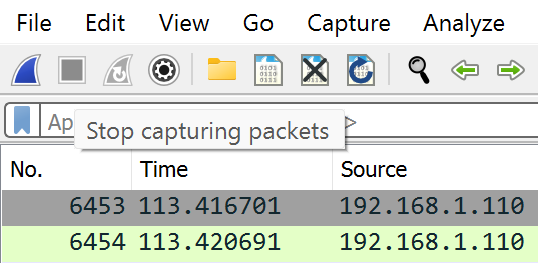
After gathering data you need to stop monitoring and click on a stop button as in the photo below:
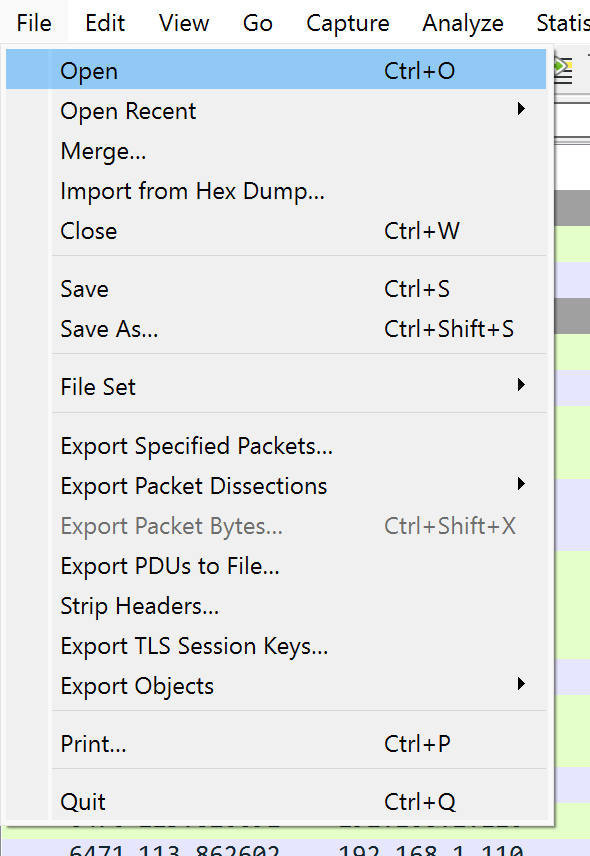
Or if you have a pcap file then open it from the menu of that program in the line above:
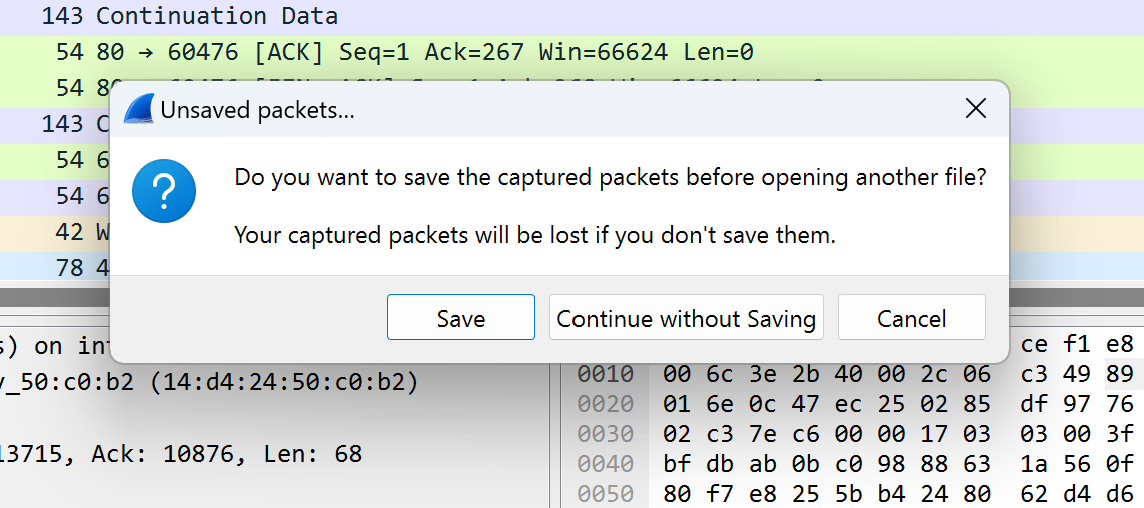
A window about saving will pop up — save or not at your choice:
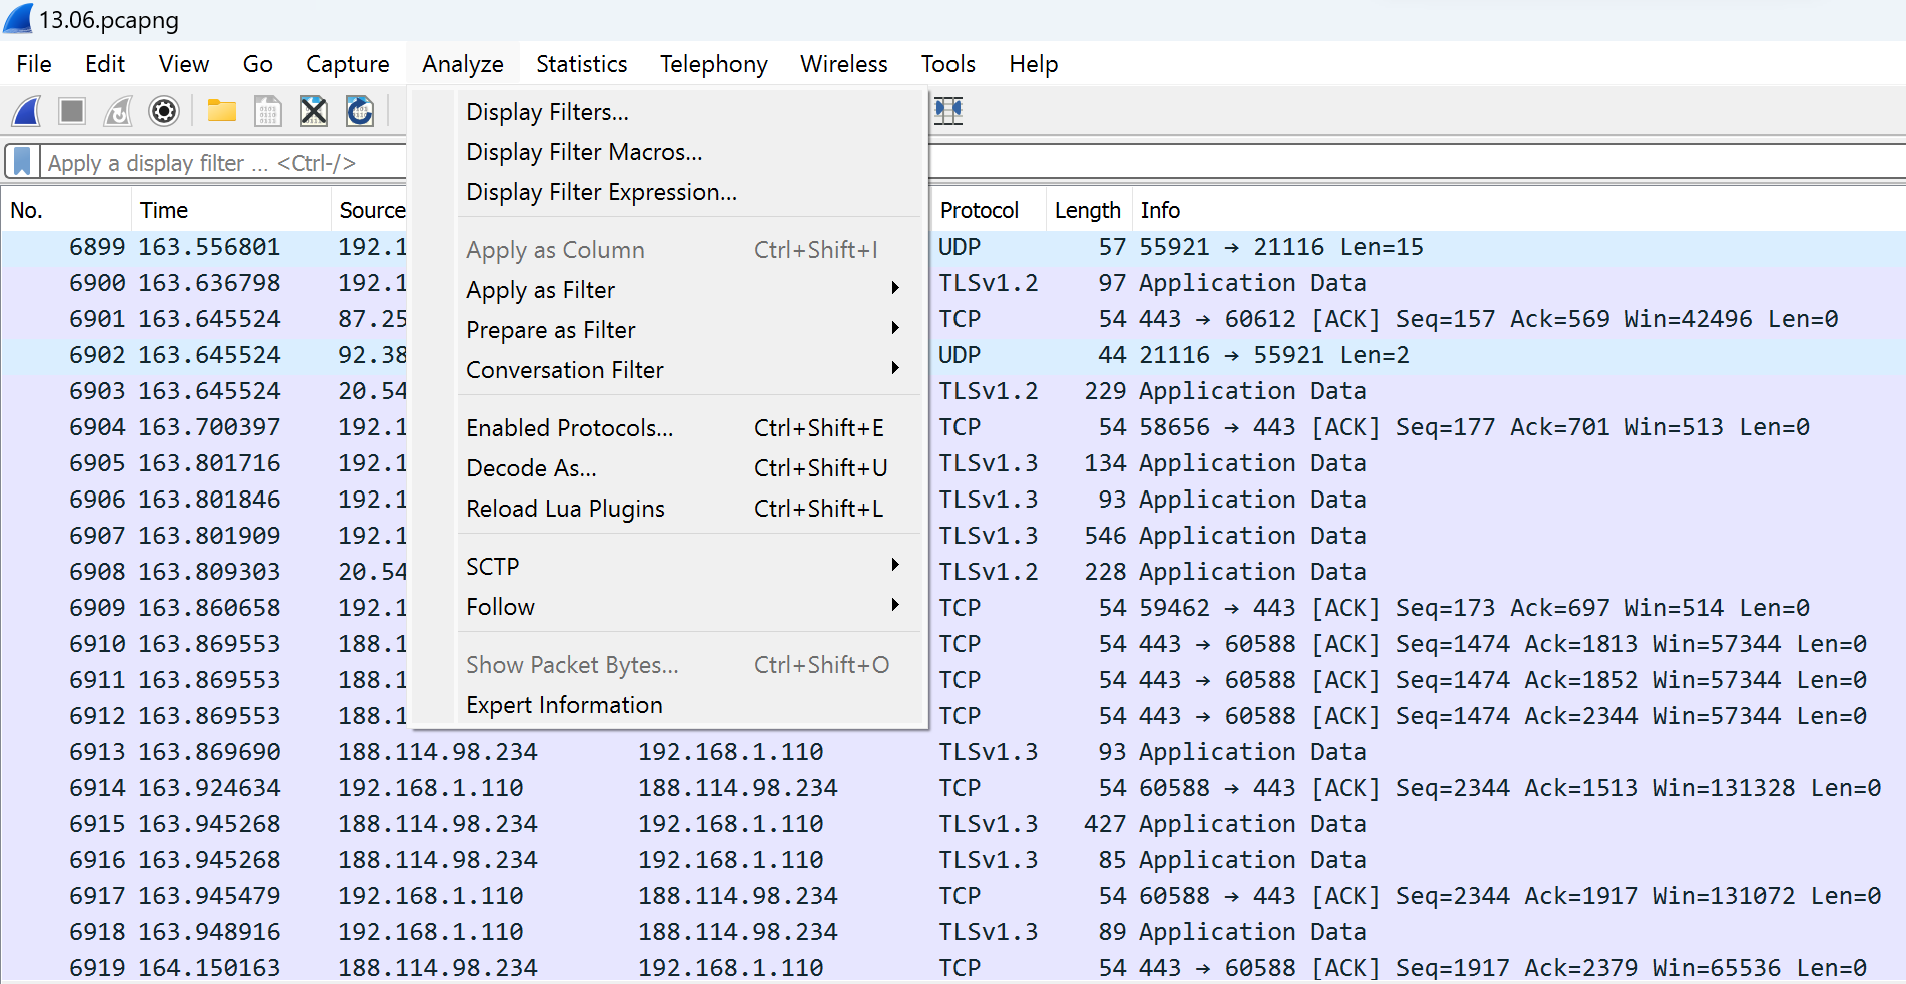
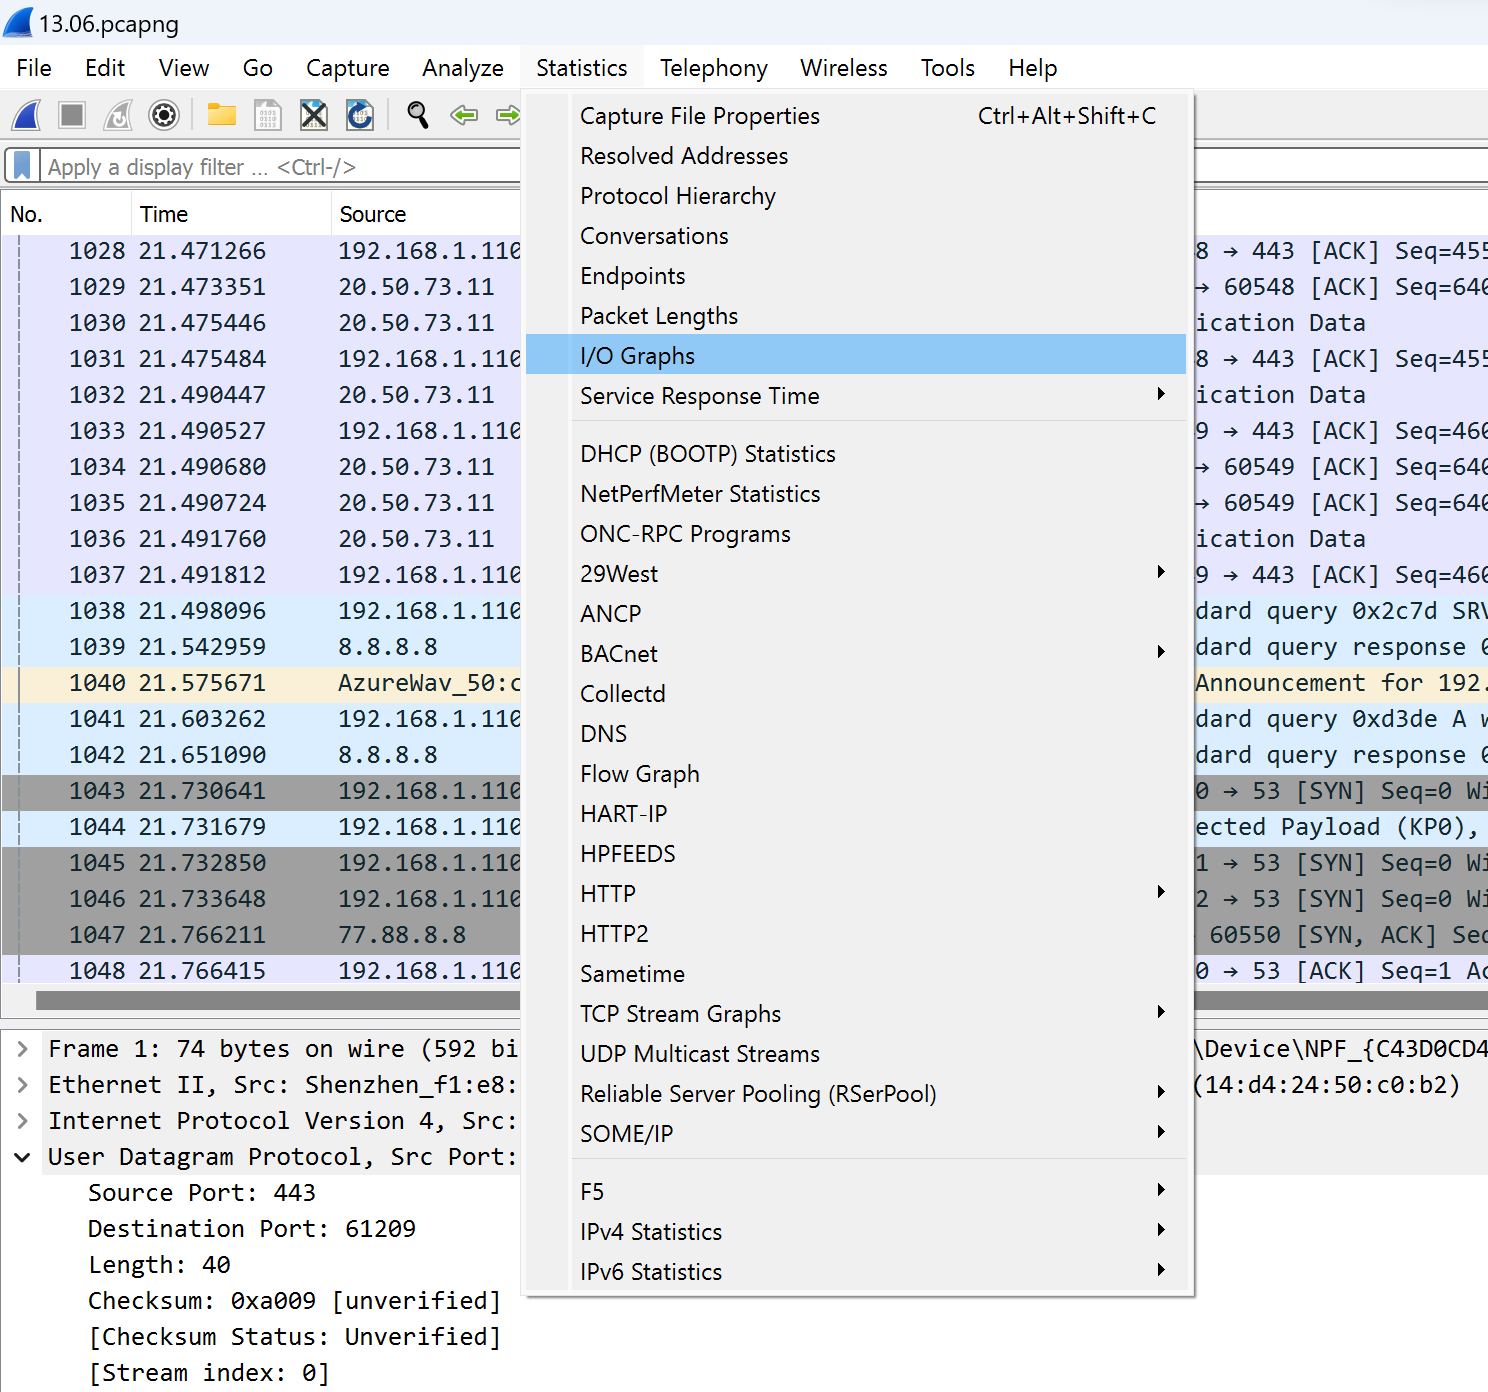
All instruments for analyzing and gathering statistics about your traffic in a network are located also in the line above, with the names “Analyze” and “Statistics”. These represent the number of diverse methods and tools in order to highlight a sense of information:
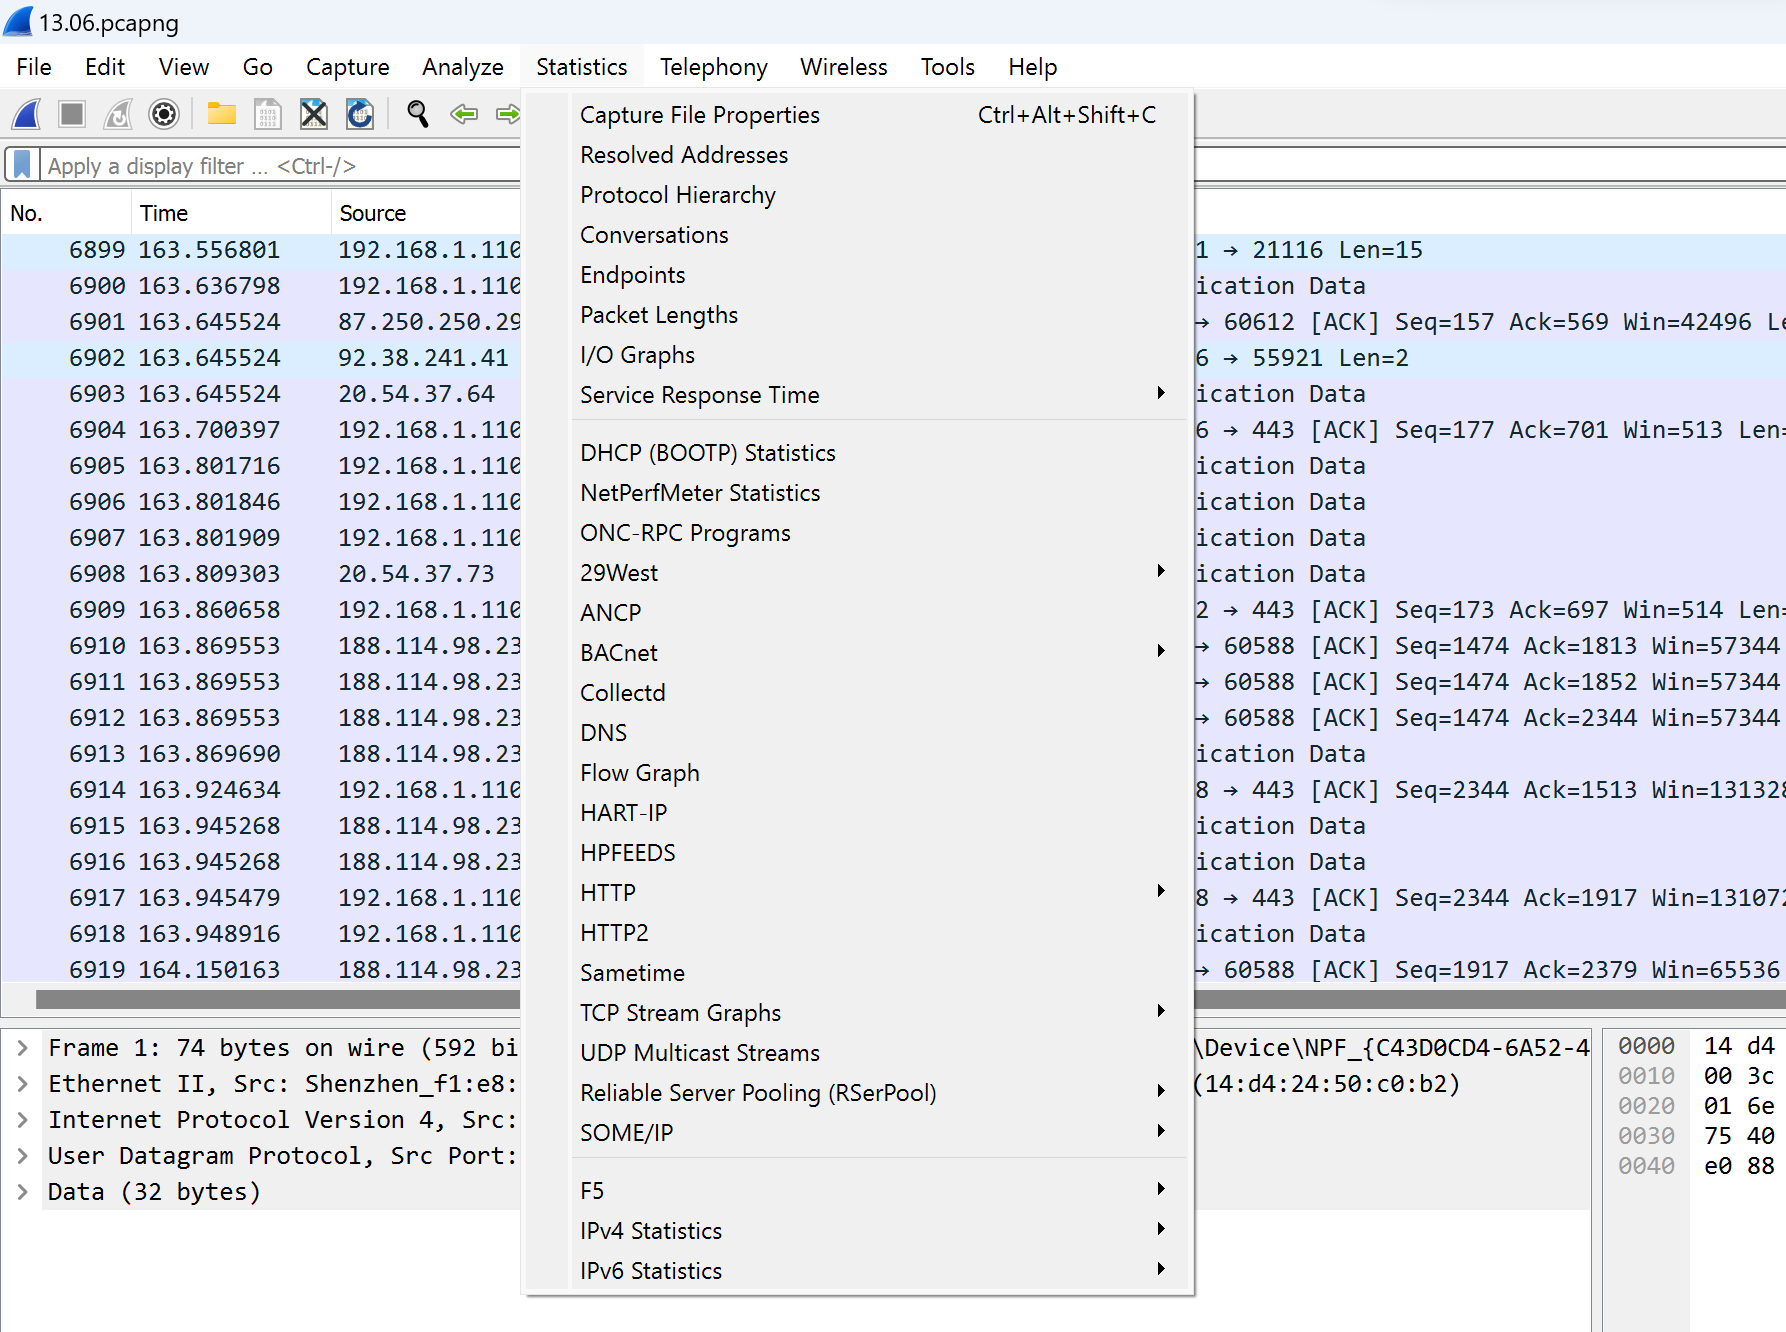
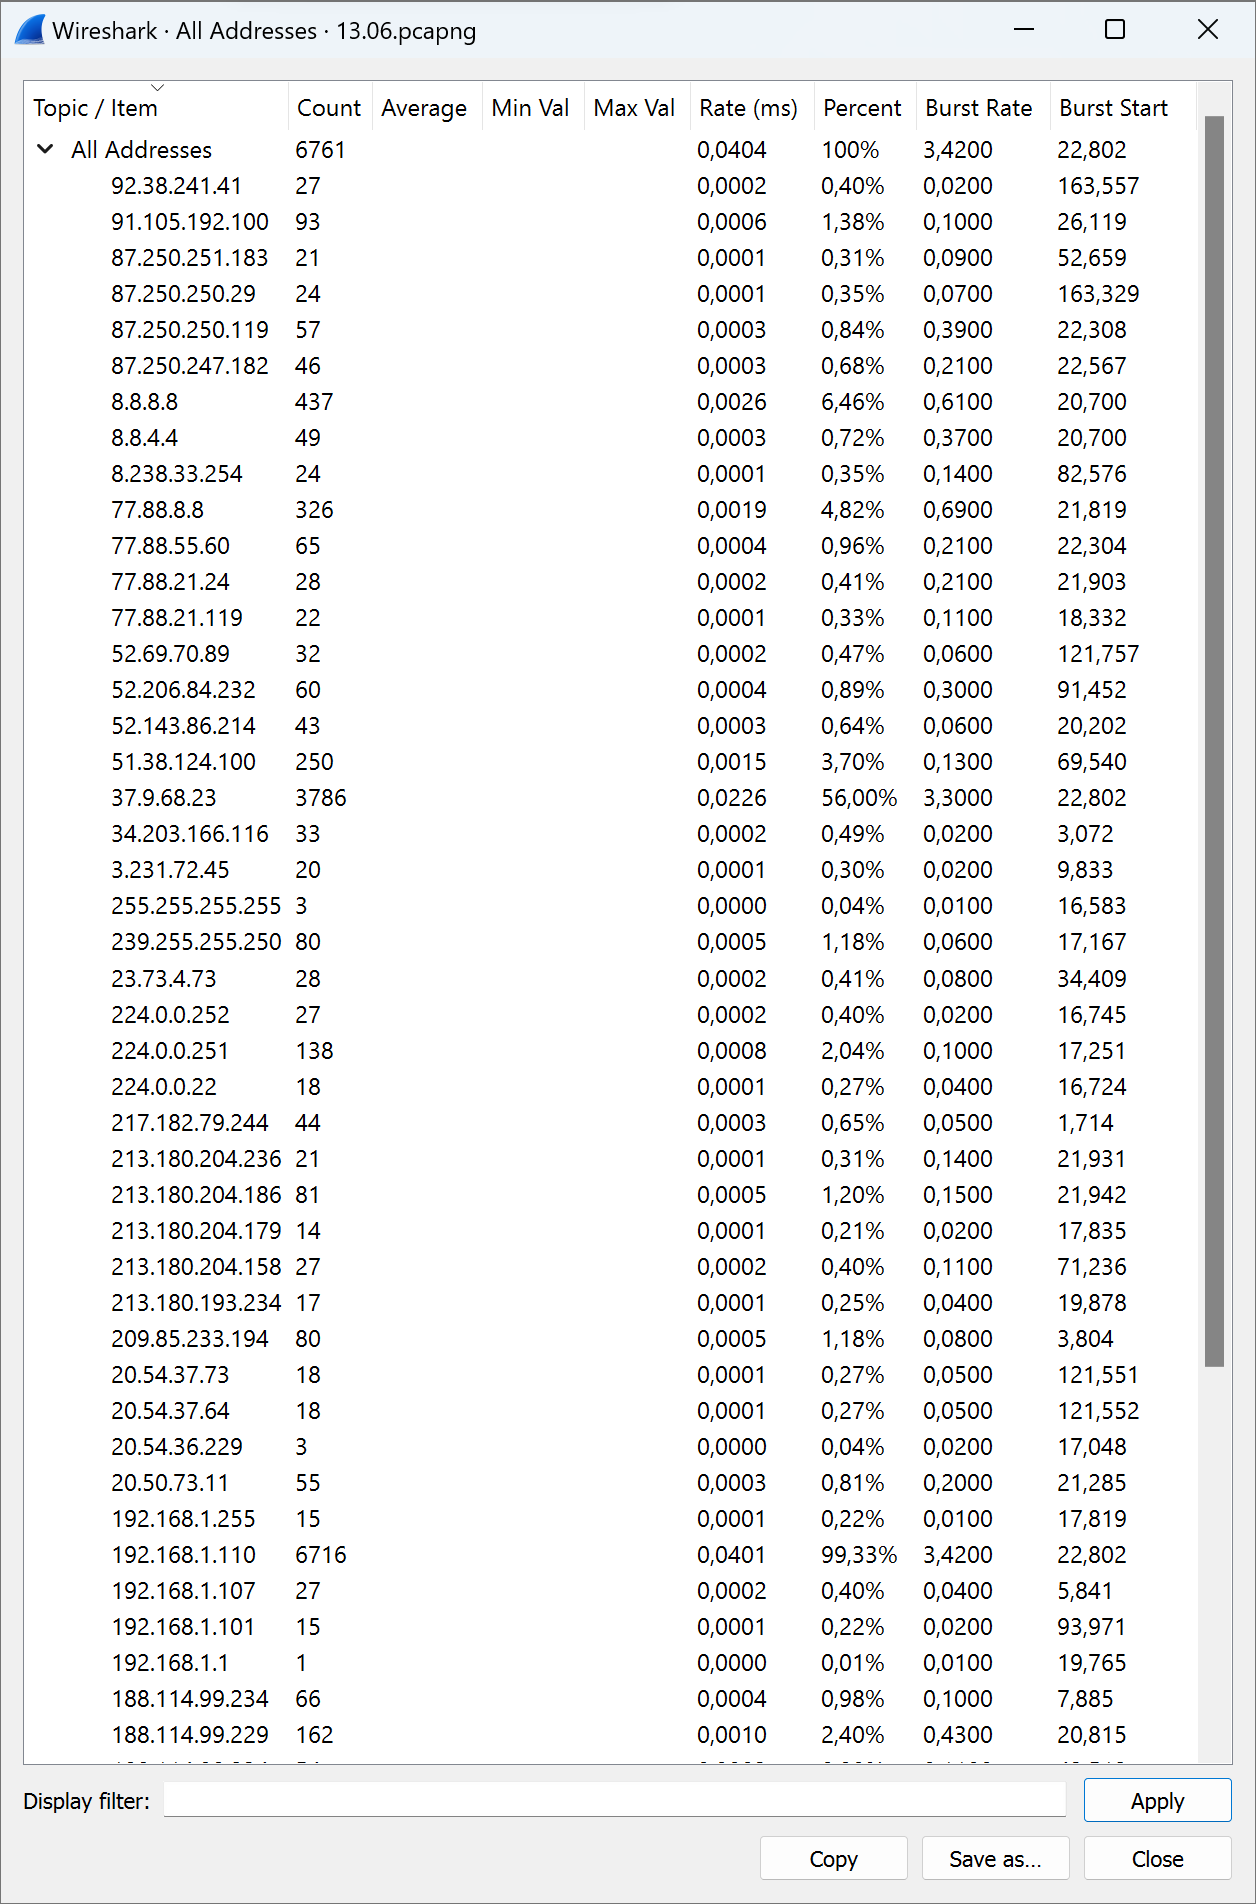
At first, we collect a list of the IP address's source and destination traffic, which will be marked as legitimized. Choose the tab Statistics, find the IPv4 point and click on the first line:
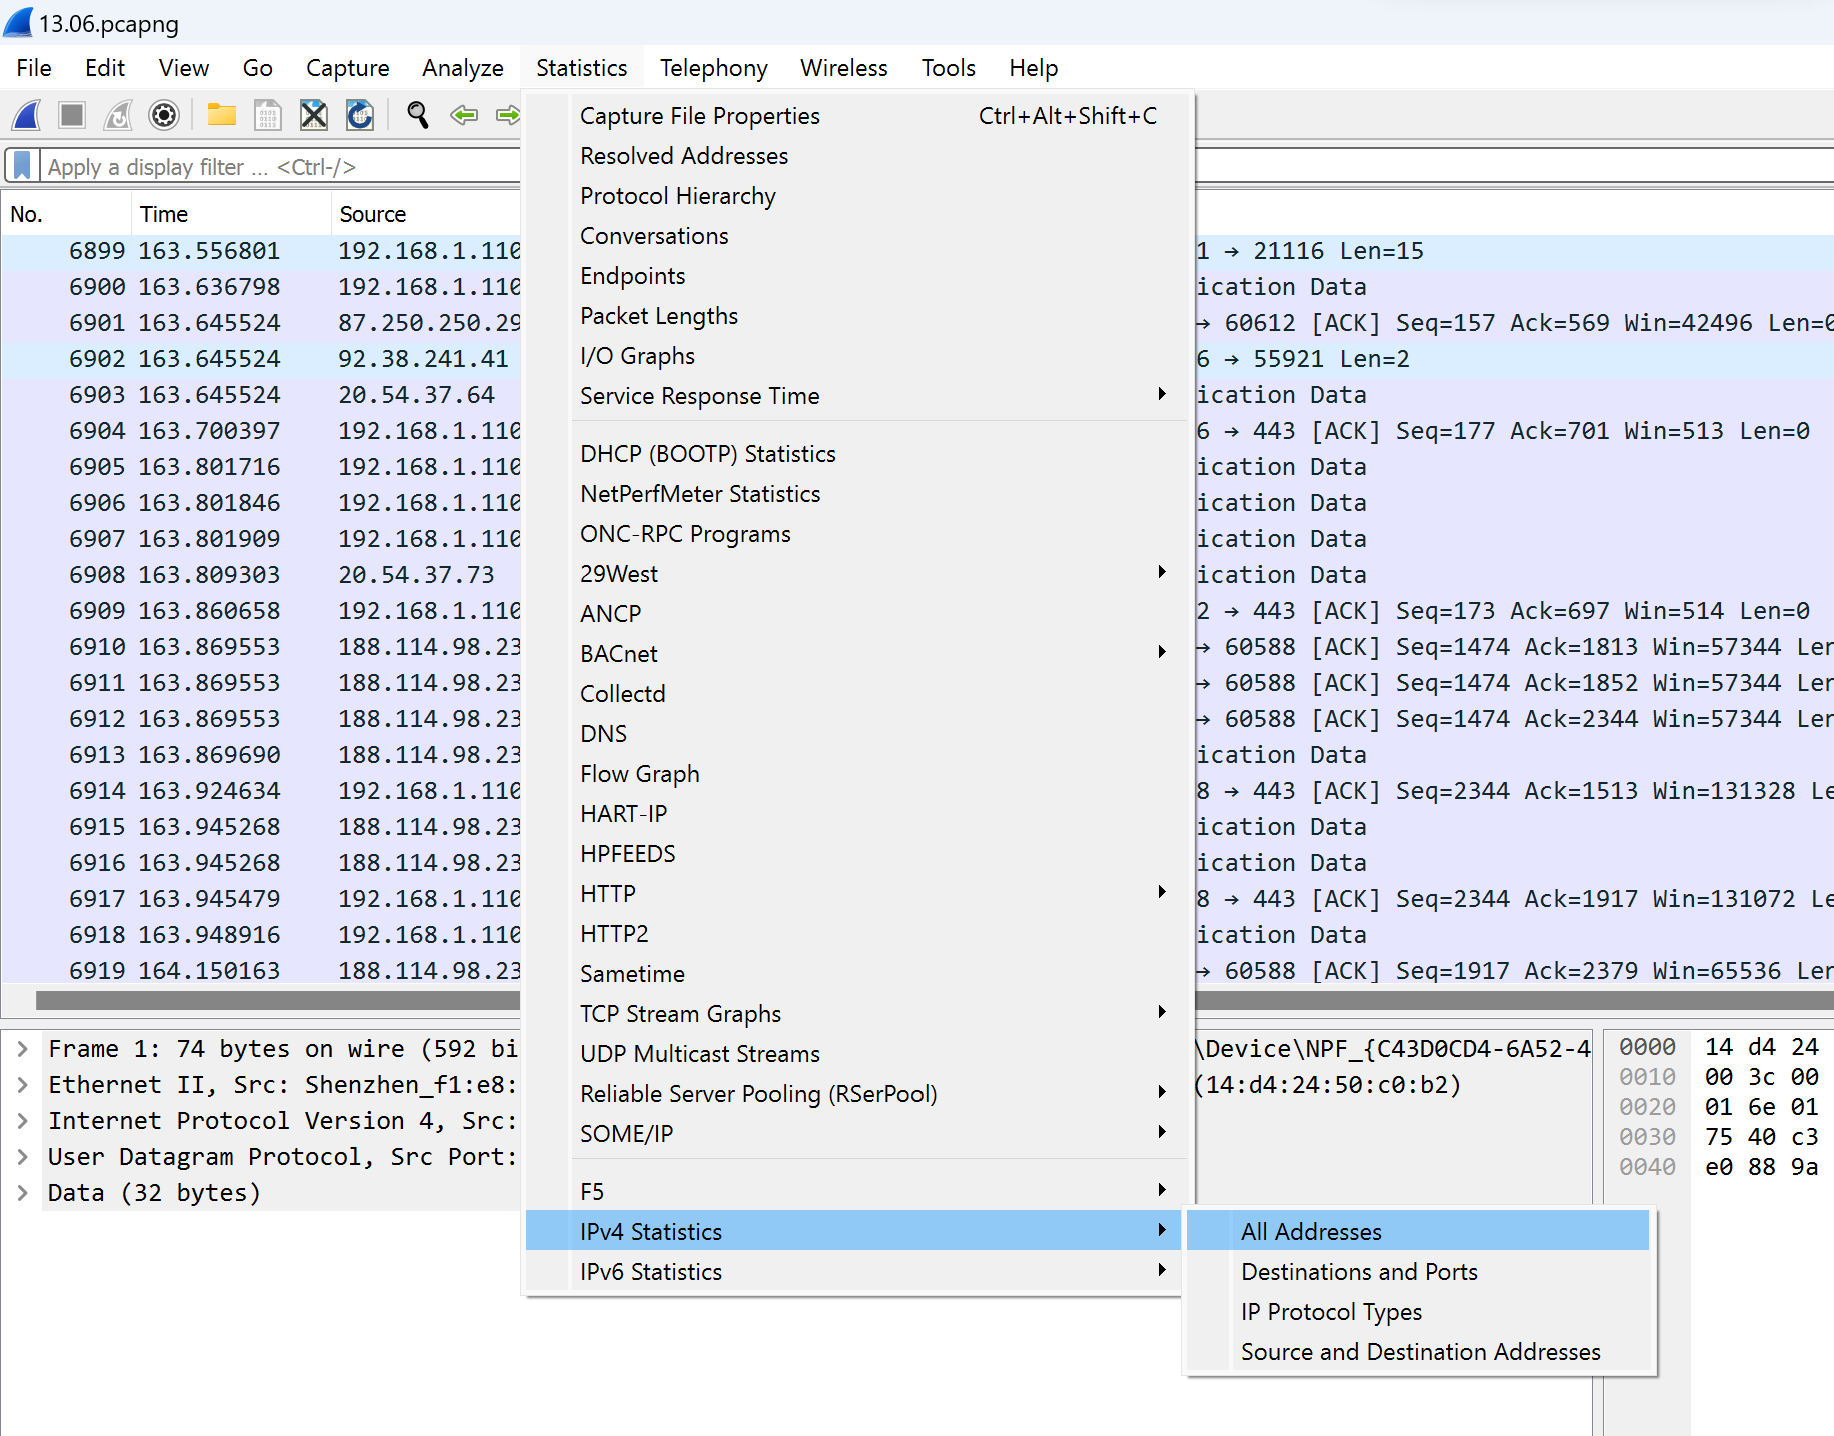
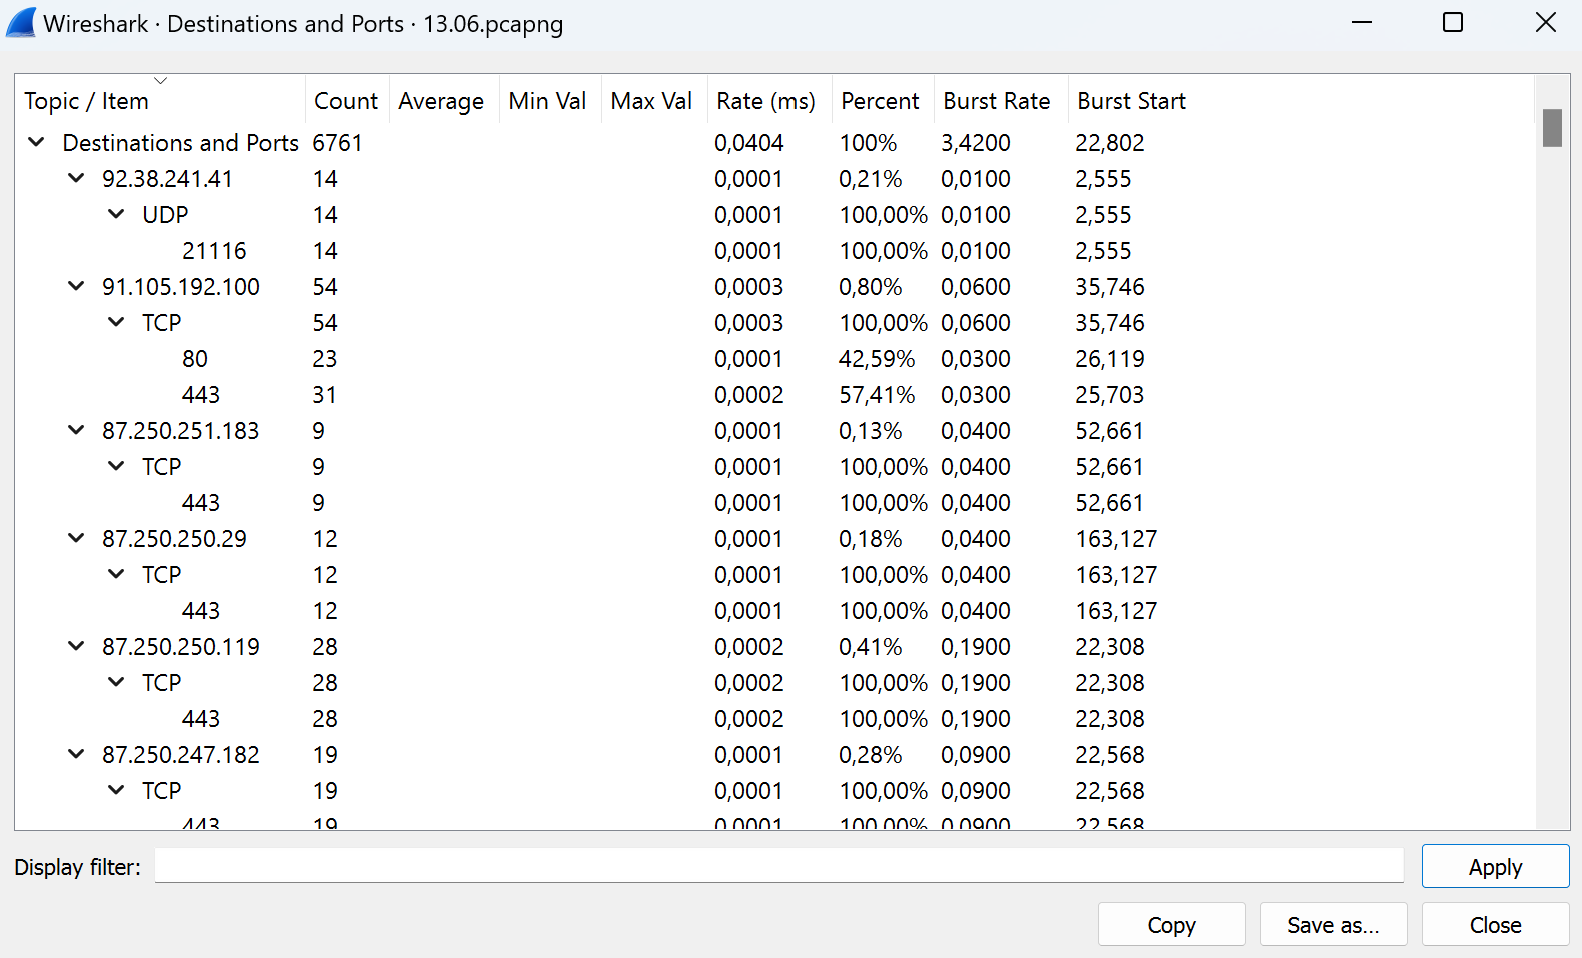
All addresses will display on the list with various parameters: frequency address in the general set, rate and percentage of total traffic. By clicking on the menu on the tab below we can see Destinations and Ports:
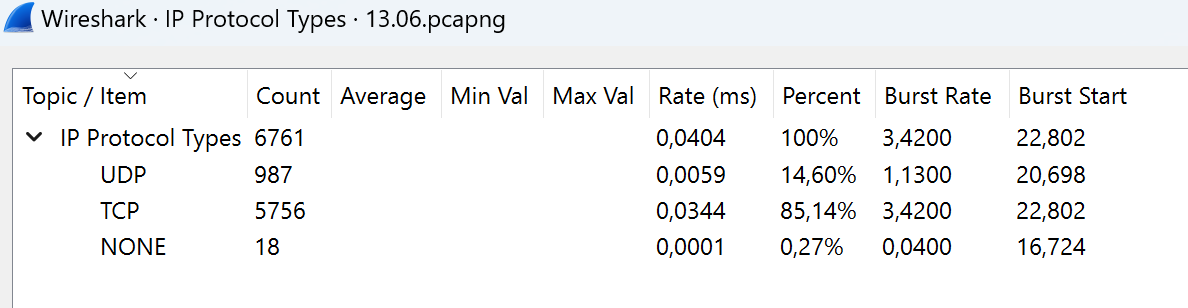
Save that information by clicking on the button Save as. Further, we consider all extracted information and make a list of important data. IP protocols we can see below:
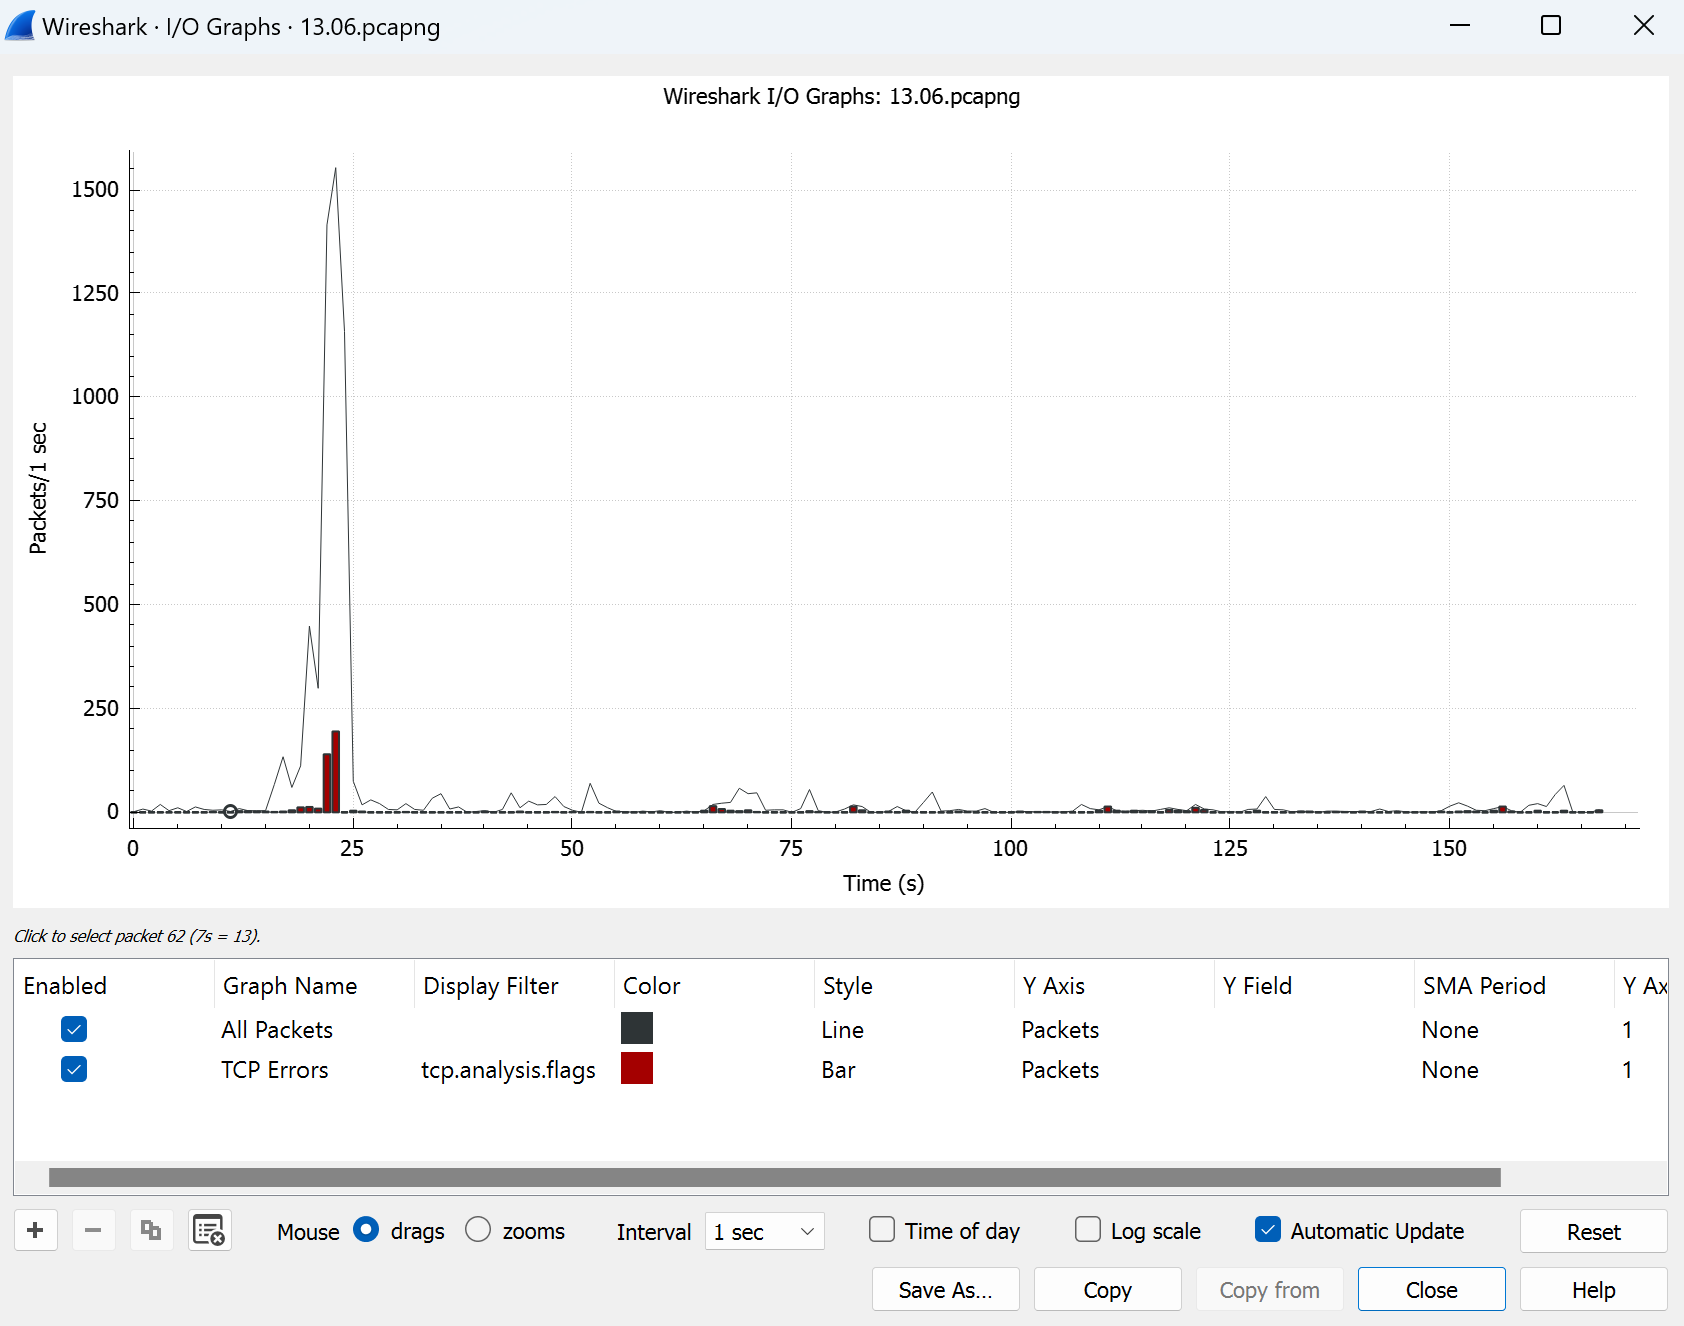
In this sniffing program, we can exploit a chart for primitive visualization of frequency packets. Click on Statistics in the tab above then choose I/O Graphs and see the result:
Conclusion
After we have taken measurements of all the dots and digital prints, we can summarize extraction data and make a conclusion about the profile of our traffic, but you can notice that the profile hasn’t been visualized part in the next episode of the series instruction we consider “How to use traffic profile for protection against DDoS?” and “How to visualise the path of traffic profile?” for make more thoroughly and deepest portrait of the legitimised user. All of that and more we can see in the next episode. Don't tune the channel!


