Modern applications are increasingly running in containers — it's convenient, scalable, and transparent to manage. We've become accustomed to trusting telemetry: if a Grafana graph shows that a container consumes a "stable" 200 MB of memory and 150m CPU — everything is under control. But reality is much more complex.
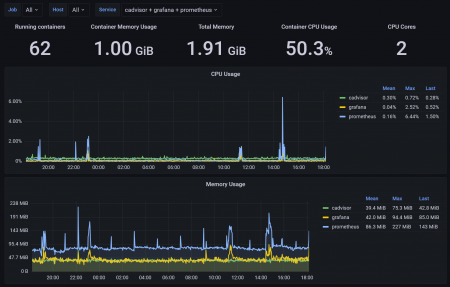
Any engineer who has faced sudden spikes in cloud bills or unexplained performance degradation knows: metrics sometimes lie. A container is not an isolated process, but part of a larger ecosystem of the node, runtime, and orchestrator. And within this ecosystem, dozens of processes occur that don't appear in monitoring reports, yet directly affect resource consumption.
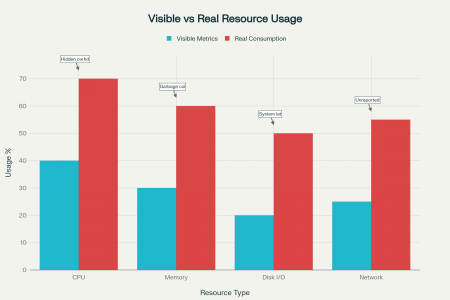
The problem is exacerbated by the fact that most visualization tools show averaged data and don't account for hidden overhead — network buffers, sidecar services, background processes, and runtime overhead. As a result, a company may spend 1.5–2 times more computing resources than the diagrams show, and by the time they react to such deviations, it will be too late.
Let's examine five hidden reasons why your containers "consume" more than the metrics reflect. Each reason will be supplemented with typical symptoms and diagnostic methods, so you can not only identify the source of overconsumption but also implement systematic control over it.
Incomplete Resource Isolation in Containers
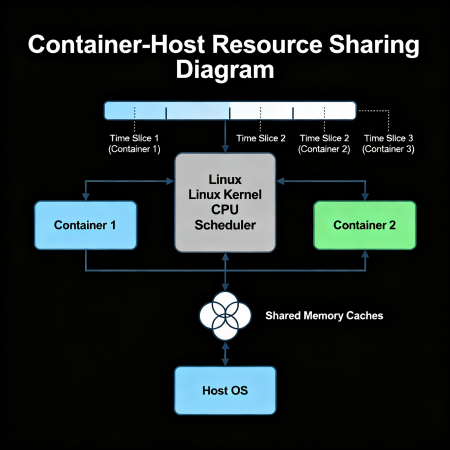
One common misconception is believing that a container lives in a completely separate "box" and uses only the resources allocated in its configuration. In practice, Linux containers rely on cgroups and namespaces mechanisms, which limit and segment resources but don't create absolute isolation.
This means that processes inside a container can share resources with other containers and with the host itself. For example, CPU cores are physically the same, and the scheduler simply redistributes their time among tasks. Metrics in this case may show "normal" load values, although actual computing power consumption is higher — due to indirect processes that the container uses but are monitored separately.
How to Identify the Problem
- Compare data inside the container (top, free -m, ps aux) with data at the node level via htop or glances.
- In Kubernetes, use kubectl top pod and kubectl top node — discrepancies in metrics often indicate a problem.
- Check page cache usage:
cat /proc/meminfo | grep -i 'cache' - Use --all-namespaces flags when viewing metrics to account for all containers, including those launched by the orchestrator itself.
Mini Prevention Checklist
- Explicitly limit container access to host resources (including volume mounts).
- Use metrics not "inside" the container, but at the pod or node level for a real picture.
- Regularly audit overhead across the entire cluster, not just at the application level.
Runtime and Infrastructure Overhead
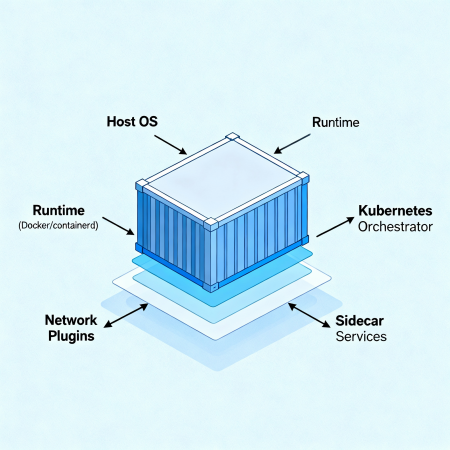
Containerization is just one part of the overall infrastructure in which services operate. Besides the container and application, there are many layers that consume resources but often remain unnoticed in standard metrics.
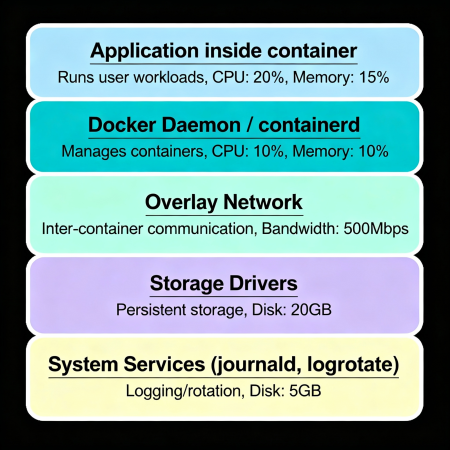
First and foremost is the runtime environment — Docker Daemon or containerd, which launches and manages containers, as well as network plugins, system logs, and storage drivers. Each of these subsystems introduces inevitable overhead that isn't always properly accounted for in popular monitoring tools.
Causes of Hidden Resource Consumption
- Docker Daemon / containerd: Management processes can consume CPU and memory, especially during large-scale operations of creating and deleting containers, as well as interacting with image registries.
- Overlay networks and CNI plugins: When working with overlay networks (e.g., Calico, Flannel), additional operations occur for routing, traffic encryption, and NAT, which complicate the calculation of actual network resource usage.
- Storage drivers: File system drivers (overlay2, aufs) add a layer of abstraction, leading to additional read/write operations and caching. This additional I/O often isn't explicitly reflected in container metrics but negatively affects node performance.
- System services journald, systemd, and logrotate: Logs generated by containers are usually directed to the host system. journald and logrotate handle their accumulation and archiving, consuming CPU and disk resources outside the container's visibility.
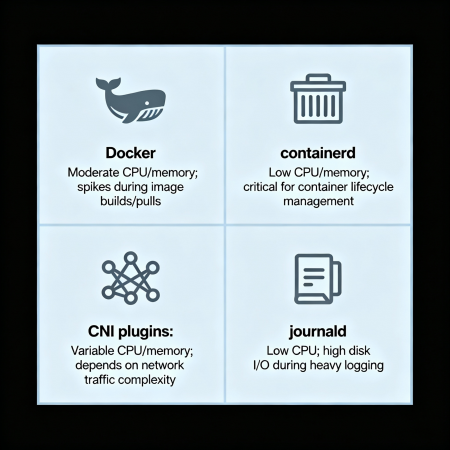
Table: Visible and Hidden Sources of Consumption
| Source | Shown in Container Metrics | Actual Contribution to Consumption |
|---|---|---|
| Application inside container | Yes | Yes |
| Sidecar and auxiliary containers | Partially | Yes |
| Docker daemon / containerd | No | Yes |
| Overlay network and CNI plugins | No | Yes |
| Storage drivers | No | Yes |
| journald and logrotate | No | Yes |
Recommendations for Managing Overhead
- Set up separate monitoring for system processes and daemons (e.g., node_exporter with systemd and docker details).
- Optimize container logging: use logging levels, apply log aggregators with filtering.
- Periodically update storage drivers and network plugins to minimize overhead.
- Plan updates and container operations during low-load periods to reduce runtime maintenance impact.
Errors in Kubernetes Limits and Requests
Kubernetes provides powerful resource management mechanisms through requests and limits parameters, which help the orchestrator efficiently place containers and ensure Quality of Service (QoS). However, incorrect or incomplete configuration often leads to distortions in metric display and in practice — resource overconsumption and unstable application performance.
Difference Between Requests and Limits
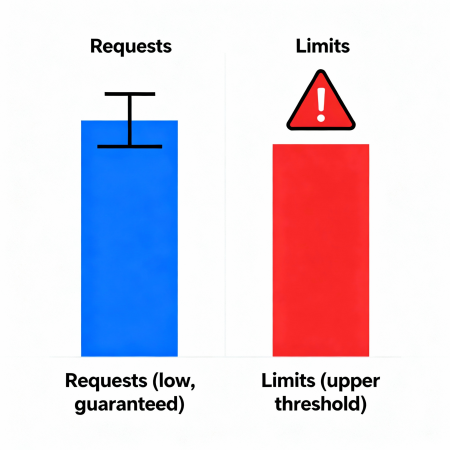
- Requests — the guaranteed minimum of resources that Kubernetes considers when scheduling a pod on a node.
- Limits — the upper boundary of resources that a container is allowed to use. When CPU limits are exceeded, throttling occurs (task slowdown), when memory limits are exceeded — may lead to eviction (pod removal).
Improper balancing of these parameters leads to different effects: a container may use more resources than visible in monitoring, or conversely — be limited by limits, which affects performance.
How Errors Affect Metrics and Consumption
- If requests are set too low, Kubernetes may pack more pods on a node, causing resource competition and unaccounted load spikes. Monitoring will show that pods exist, but the node is running "at the limit," and pods experience throttling.
- With excessively high limits without adequate requests, an application may unexpectedly use resources (CPU/memory), but Prometheus and kubectl top will only show averaged values, hiding actual usage.
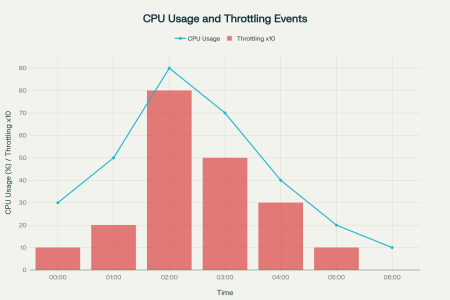
- When CPU limits are exceeded, frequent throttling events occur, which aren't always immediately visible in metrics but lead to performance degradation.
Graph and Analysis
How to Properly Configure Limits and Requests
- Start with analyzing the application's load profile under load testing and measurements on Dev/Stage.
- Set requests at least to the baseline consumption level so Kubernetes can properly place the pod.
- Limits should be slightly above average peak values, accounting for reserves for unexpected loads.
- Use Kubernetes QoS class metrics, kubectl describe pod for diagnosing throttling and memory evictions.
Brief Checklist
- Use kubectl describe pod <pod-name> to find signs of throttling and eviction.
- Configure vertical resource autoscaling (Vertical Pod Autoscaler) for dynamic adjustment.
- Integrate alerts for throttling events (e.g., kube-state-metrics).
- Conduct regular audits and reviews of current limits/requests together with business teams.
Collector- or Agent-Induced Data Distortion
Monitoring systems are an important part of infrastructure for controlling the state of containers and applications. However, the paradox is that metric collection agents themselves can consume significant resources, distorting the overall consumption picture and creating additional cluster loads.
How Agents Affect Resources
- CPU and memory load: Agents such as Prometheus Node Exporter, Datadog Agent, or Fluentd collect and process large amounts of data in real-time, requiring processor cycles and memory. This is especially evident in large clusters with hundreds and thousands of pods.
- Monitoring network traffic: When using push or pull models, additional network traffic arises between agents, servers, and monitoring databases, which can lead to delays and application slowdowns.
- Memory leaks and failures: Incorrect configuration or bugs in agents can lead to gradual growth in memory consumption (memory leak), significantly increasing node load.
Recommendations for Minimizing Monitoring Agent Impact
- Use lightweight agents and alternate metric collection strategies — for example, combine pull and push models to reduce network load.
- Configure sampling and filtering of data to avoid collecting excessive and uninformative metrics.
- Implement horizontal agent scaling and distribute load among multiple instances.
- Regularly update agents to the latest versions, which have known memory leaks fixed and optimized resource consumption.
- Monitor the agents themselves as a separate service with alerts for anomalous memory and CPU consumption.
Brief Checklist
- Check current agent load with top or htop command on nodes.
- Analyze monitoring network traffic to eliminate bottlenecks and "hot" spots.
- Apply log filters and reduce log detail level for Fluentd or similar agents.
- Use lightweight exporters instead of full agents where possible (e.g., node_exporter instead of full datadog agent).
- Configure regular cleanup and reprocessing of monitoring data, excluding outdated or duplicate metrics.
We've examined five hidden reasons why containers may consume significantly more resources than familiar metrics show. From incomplete resource isolation and background leaks in sidecar containers to invisible runtime and infrastructure overhead, errors in Kubernetes Limits/Requests, and the impact of monitoring agents — all these factors create a gap between visible indicators and actual load.
Understanding and diagnosing each of these causes allows not only more accurate assessment of cloud resource utilization efficiency but also significantly reduces risks of budget overconsumption and unexpected downtime. It's important not to limit yourself to superficial analysis of metrics inside the container, but to look at the full picture — including nodes, runtime, auxiliary services, and monitoring tools.
It's recommended to build a systematic approach to auditing and monitoring, implement advanced methods of data correlation and alert automation, and optimize resource configurations and monitoring agent logic. This will help increase visibility of actual resource usage and qualitatively improve enterprise cloud infrastructure management.
Start simple — conduct a review of current metrics and set up monitoring at the node and runtime level. Then — gradually expand the audit to optimize Kubernetes requests and agent load. Such a proactive approach will ensure stability, efficiency, and economy in containerized application operations.
FAQ
- Question 1: Why doesn't Kubernetes always show accurate container CPU usage data?
Answer: Kubernetes relies on cgroups for metric collection, but due to overall node load and task scheduling, actual CPU load may differ from indicators, especially when using overlay networks and background processes. Metric averaging and collection delays also affect accuracy. - Question 2: How do sidecar containers affect the main application's resource consumption?
Answer: Sidecar containers, for example for logging or proxying, run in the same pod but consume separate resources. Main container metrics often don't account for their load, leading to underestimation of total pod consumption. - Question 3: Why monitor resources at the node level and not just the container?
Answer: Container metrics show usage within limits, but node resources are managed by the kernel and runtime, which also consume CPU and memory. Node monitoring allows you to see full overhead and avoid surprises with overconsumption. - Question 4: How to properly set Limits and Requests to avoid throttling?
Answer: Start with analyzing the application's load profile, set requests at least to the baseline consumption level, and limits slightly above maximum peaks. Use vertical autoscaling tools and monitor throttling events. - Question 5: How to reduce the impact of monitoring agents on resource consumption?
Answer: Use lightweight agents, apply sampling and data filtering, distribute load across multiple agent instances, and regularly update them to fix memory leaks and optimize performance.


