
What's important to know before installation
Grafana supports the following databases:
- SQLite
- MySQL
- PostgreSQL
Requirements for the stable operation of Grafana:
- Processor - 1 CPU
- RAM - 500 mb
- Free space on disk - 25 gb

Creating a server under Softaculous thanks to Serverspace.
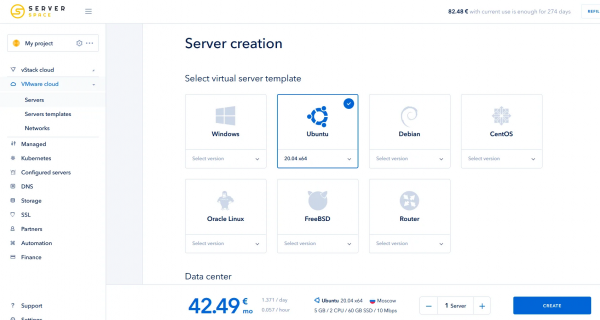
Let's create a server that will meet the recommended characteristics.
To create servers, do the following steps:
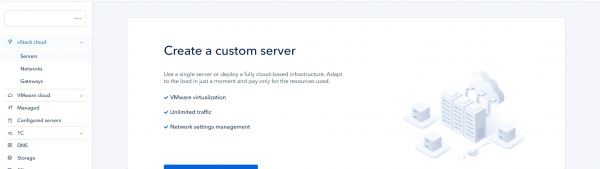
- Login to your personal area, go to the vStack cloud > Servers tab and click Create Server:
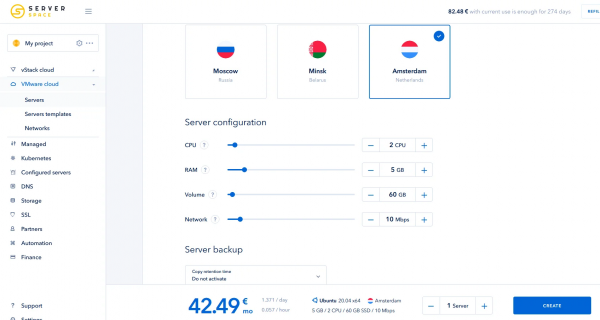
- Select the recommended requirements and click Create:
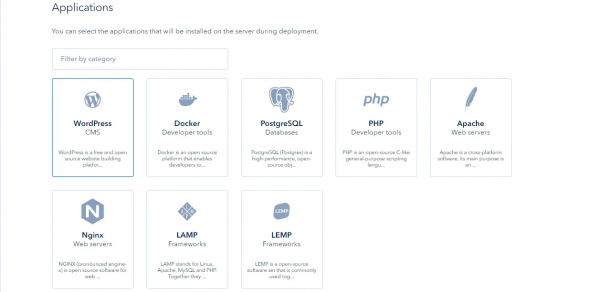
- If you need to install any applications, you can do this during the deployment phase:
- Don't forget to configure access to the server. (Either via a private ssh key or using login + password)
1. The installation of Grafana comes from the official developer's repository.
Download the GPG key and add it to the list of trusted keys.
wget -q -O - https://packages.grafana.com/gpg.key | sudo apt-key add –![]()
![]()
2. Now you have to add it to the Grafana repository.
sudo add-apt-repository "deb https://packages.grafana.com/oss/deb stable main" 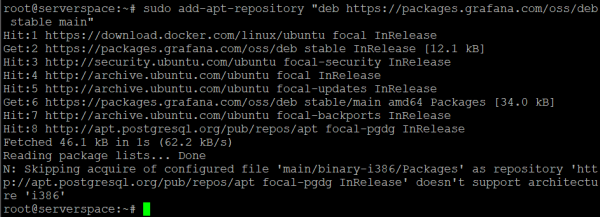
3. Once it has been added, we need to update the ART cache and continue the installation of Grafana.
sudo apt update
sudo apt install grafana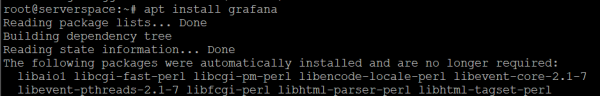
If you get this error at the end of the installation:
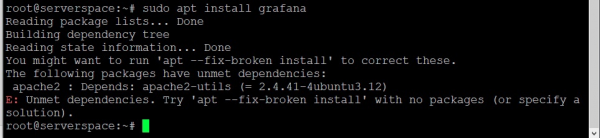
Type "apt -fix-broken install" and try again, it may work.
apt -fix-broken install4. After the installation, add grafana to the autostart and start the Grafana daemon itself.
sudo systemctl enable grafana-server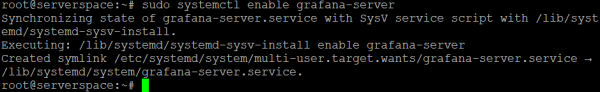
sudo systemctl start grafana-server
5. The installation of the Grafana repository on Ubuntu is finished and it is ready to be used.
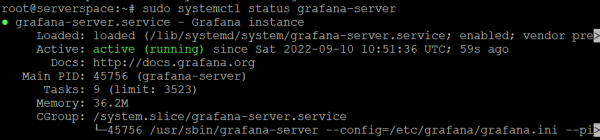
And finally, check the status of Grafana:
sudo systemctl status grafana-serverIf everything is set up correctly, the result will be the output:
Demonstration of the firewall configuration to allow access to Grafana.
The default configuration shows that Grafana is only available on port 3000. However, if we want to use the iptables or firewall, we have to grant them access to the network on this port. firewalld command set. (a new rule needs to be added and the firewalld service needs to be restarted for the configuration to be applied)
firewall-cmd --zone=public --add-port=3000/tcp –permanent![]()
![]()
systemctl reload firewalld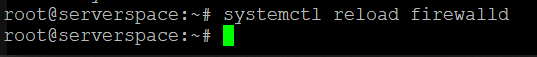
instruction set iptables:
nano /etc/sysconfig/iptablesThen find the OUTPUT ACCEPT section and enter the following line:
-A INPUT -p tcp -m tcp --dport 3000 -m state --state NEW -j ACCEPT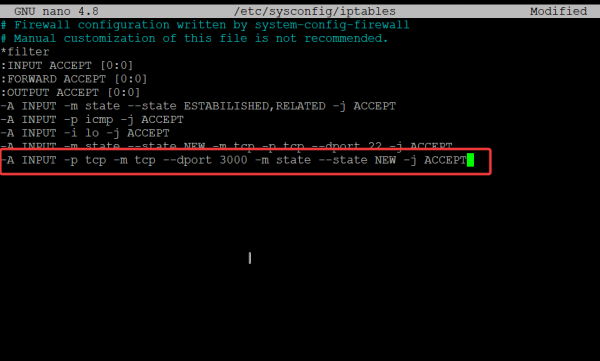
And reload iptables:
sudo systemctl restart iptables![]()
![]()
After all the manipulations described above, the firewall will allow access to the connection via port 3000. You can easily check this by opening a new tab in the Grafana interface. The default login information is admin (login and password).
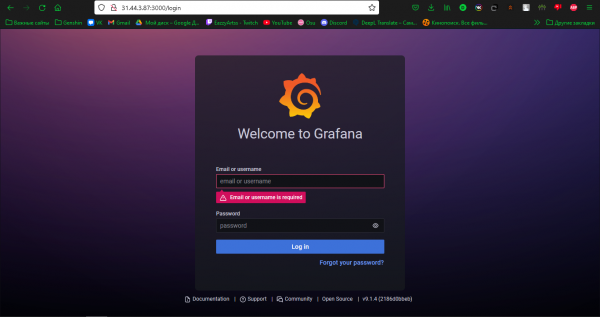
After entering the login and password, we are prompted to enter a new password (enter your ultra-complicated password).
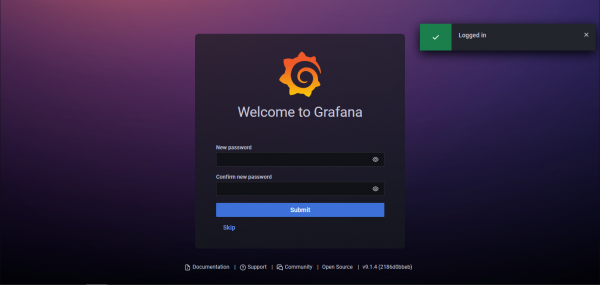
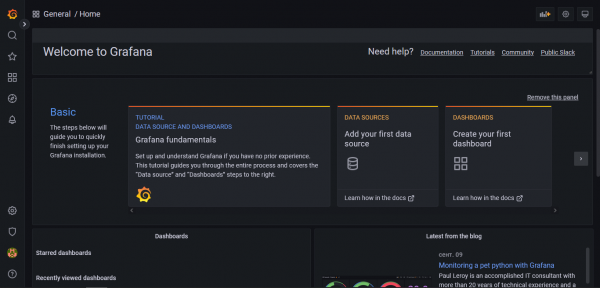
And after that we successfully enter Grafana.
If you are unable to log in to Grafana or if you have changed your password, you can reset the password of the administrative WEB interface via the CLI :
grafana-cli admin reset-admin-password --homepath "/usr/share/grafana" new_passwordAfter these operations, you can try again to access the Grafana WEB interface by entering your new password.
Conclusion:
Using this publication, you can easily install Granfana monitoring system on a server with Ubuntu 20.04 operating system.


