
A dashboard is a graphical representation of data that allows you to visualize and monitor different aspects of your IT infrastructure in real-time. Dashboards typically include widgets that display important metrics and information about your network, servers, applications, and more.

Creating a Dashboard
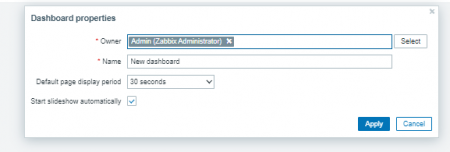
To create a dashboard in Zabbix, log in to your web interface and navigate to the "Dashboards" tab → Click the "Create dashboard" button in the top right corner of the screen.
Set the owner, enter a name for your dashboard, and choose what period of time it will be showing by default
Click the "Apply" button.
Adding Widgets to Your Dashboard
Once you've created your dashboard, you can start adding widgets to display the metrics and data you're interested in. Here's how to do it:
Click the "Add widget" button on your dashboard.
Choose the type of widget you want to add. Zabbix provides several pre-defined widget types, including graphs, maps, status indicators, and more.
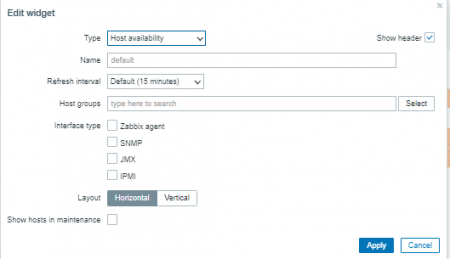
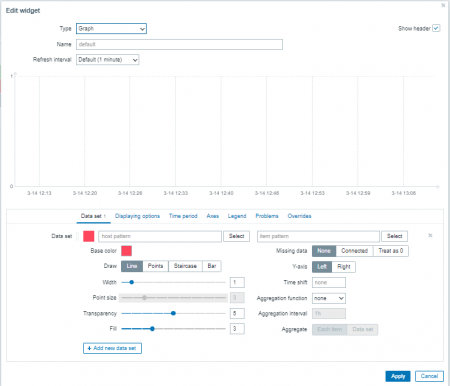
Configure the widget settings, including the data source, time range, and any other customization options that are available.
Click the "add" button to add the widget to your dashboard.
Customizing Widgets
Zabbix allows you to customize widgets to suit your needs. Here are some of the ways you can customize your widgets:
- Resize the widget by clicking and dragging the bottom right corner.
- Move the widget around the dashboard by clicking and dragging the top bar.
- Edit the widget settings by clicking the "Edit" button in the top right corner.
- Delete the widget by clicking the "Delete" button in the top right corner.
-
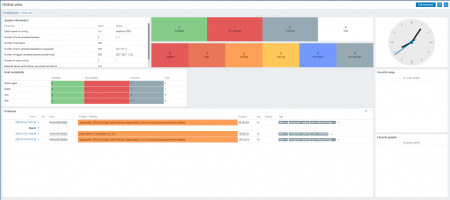
![Dashboard4]()
Default Zabbix dashboard
Conclusion
Dashboards in Zabbix are the fastest way to turn raw monitoring data into an actionable, real-time view of your infrastructure. In this guide, you created a dashboard, added and configured widgets, and adjusted layout by resizing and rearranging components in edit mode.
To scale dashboards for teams, use built-in sharing (public/private, read vs read-write), and reuse work by cloning dashboards or copy/pasting widgets across tabs. For wallboards and NOC screens, split content into multiple pages and enable a slideshow rotation so key views cycle automatically.
FAQ
- Q1: What’s the difference between a public and a private dashboard?
A: Public dashboards are visible to all users. Private dashboards are visible only to the owner and to the users/user groups added in sharing preferences. - Q2: Can I give someone view-only access to a dashboard?
A: Yes. In sharing preferences you can grant read-only or read-write access for both user groups and individual users. - Q3: Why don’t my widget changes apply after editing?
A: Make sure you click Apply in the widget configuration and then Save changes on the dashboard itself. - Q4: Can I reuse widget settings instead of configuring everything again?
A: Yes. Zabbix supports copying and pasting widgets within the same dashboard or between dashboards opened in different tabs. - Q5: How do I create a slideshow for a wallboard?
A: Add two or more dashboard pages and enable automatic slideshow in dashboard properties (or use the slideshow=1 URL parameter). Page rotation follows the display periods you set. - Q6: What are the most useful widgets to start with?
A: Common picks are Problems, Trigger overview, Host availability, Graph, Item value/Gauge, Top items/hosts, and Map/Geomap. - Q7: Can I download a widget as an image?
A: Some widgets support “Download image” from the widget menu in view mode, saving the widget as a PNG. - Q8: Can regular users edit dashboards?
A: Only if their role allows it and they have read-write rights granted through sharing. Regular users cannot change the dashboard owner.


