
Nginx is a popular and versatile web server frequently used to serve static files, act as a reverse proxy, or balance incoming web traffic. It has earned a reputation for its high performance, stability, and flexibility, making it a preferred choice for many web administrators. Like any critical service, keeping track of Nginx’s health and performance is essential to prevent downtime and quickly identify potential issues. In this guide, we will demonstrate how to monitor Nginx using Zabbix, enabling you to proactively detect anomalies, optimize server performance, and maintain a reliable web environment.

Preparations
Prior to setting up Nginx monitoring in Zabbix, it’s important to confirm that your environment meets all necessary prerequisites. Ensuring these requirements are in place will make the setup process smoother and more reliable. You should have the following prepared:
- A server with Nginx you'll want to look after
- Zabbix server up and running
- A Zabbix agent installed and configured on a server running Nginx.
Configuring Nginx
Open the /etc/nginx/conf.d/stub_status.conf file with the editor of your choice and paste the following text block:
server {

listen 127.0.0.1:80;

server_name 127.0.0.1;

location /nginx_status {

stub_status on;

access_log off;

allow 127.0.0.1;

deny all;

}

location = /basic_status {

stub_status;

allow 127.0.0.1;

allow ::1;

deny all;

}

}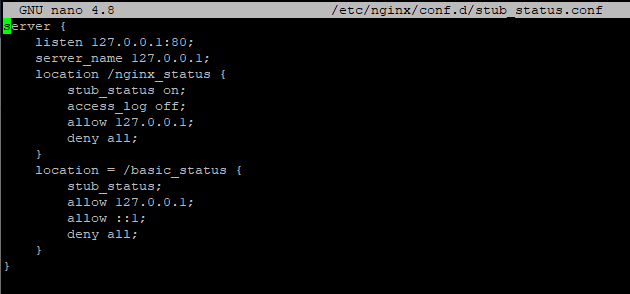
It makes the server generate basic status information on /basic_status page available only from this same server, so our agent can get it to the server.
Now lets check if Nginx procces is fine with new settings by running:
nginx -tsystemctl restart nginxsystemctl status nginx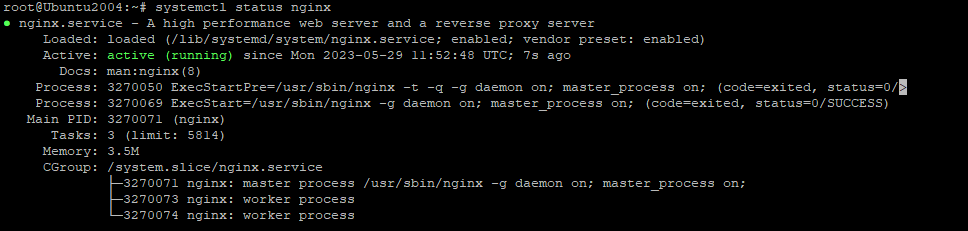
Next lets's see if the new status page works with curl:
curl http://127.0.0.1/basic_status
Configuring logs
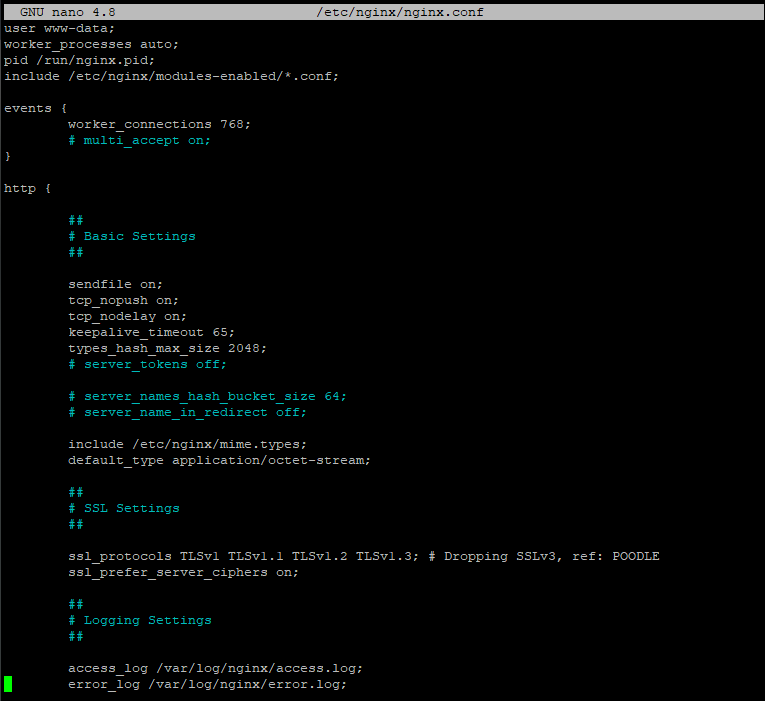
You should check if Nginx generates the logs needed by Zabbix by checking logging settings in /etc/nginx/nginx.conf
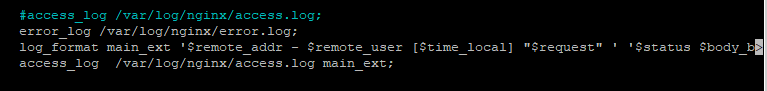
Now for Zabbix to work with logs let's comment the original access_log line and paste this fragment:
It should be looking like this:
Check and restart Nginx another time, and let’s get to configuring our Zabbix.
Configuring Zabbix
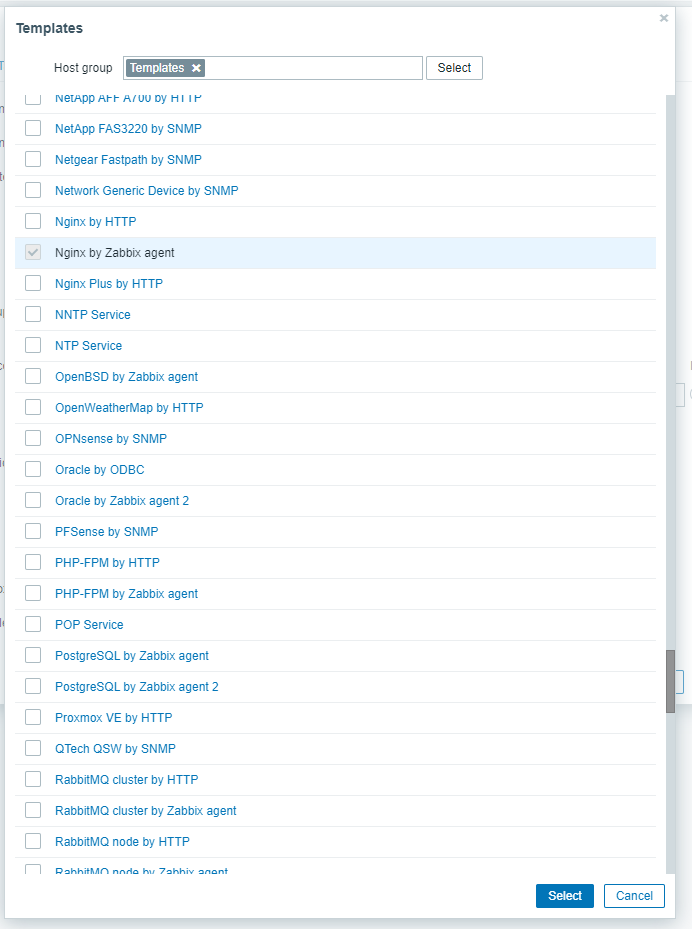
Assuming that all previous instructions have been completed, you now only need to create a host for this server and add Nginx by Zabbix agent template to it, or add it to an already existing one.
Assign the template to the host running Nginx by going to Configuration → Hosts → Select the host → Templates → Add.
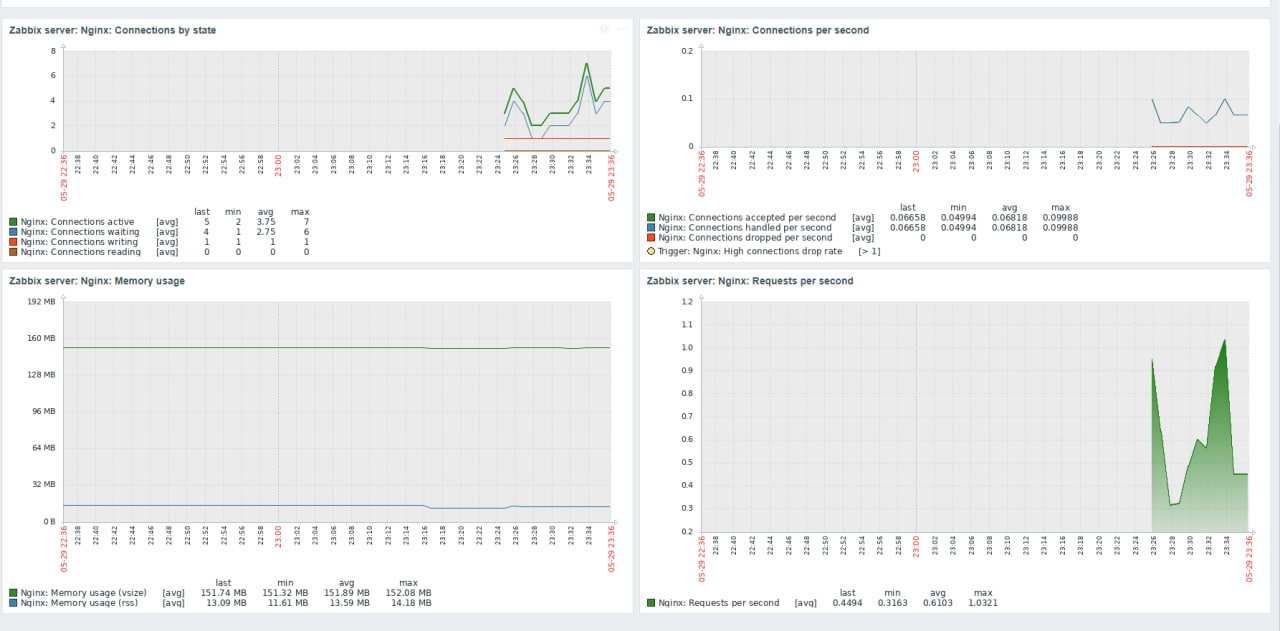
If everything is right you must be able to work with the data which is provided by the template:
- General metrics: CPU and memory usage, number of connections currently open to the server.
- Request metrics: The average time to respond to a request, percentage of requests that result in an error, number of requests processed by Nginx per second.
- SSL metrics: How many handshakes are processed by Nginx per second, the amount of ciphers that are supported by Nginx, and the count of certificate errors that are encountered by Nginx.
- Uptime: tracks how long Nginx has been running without any downtime.
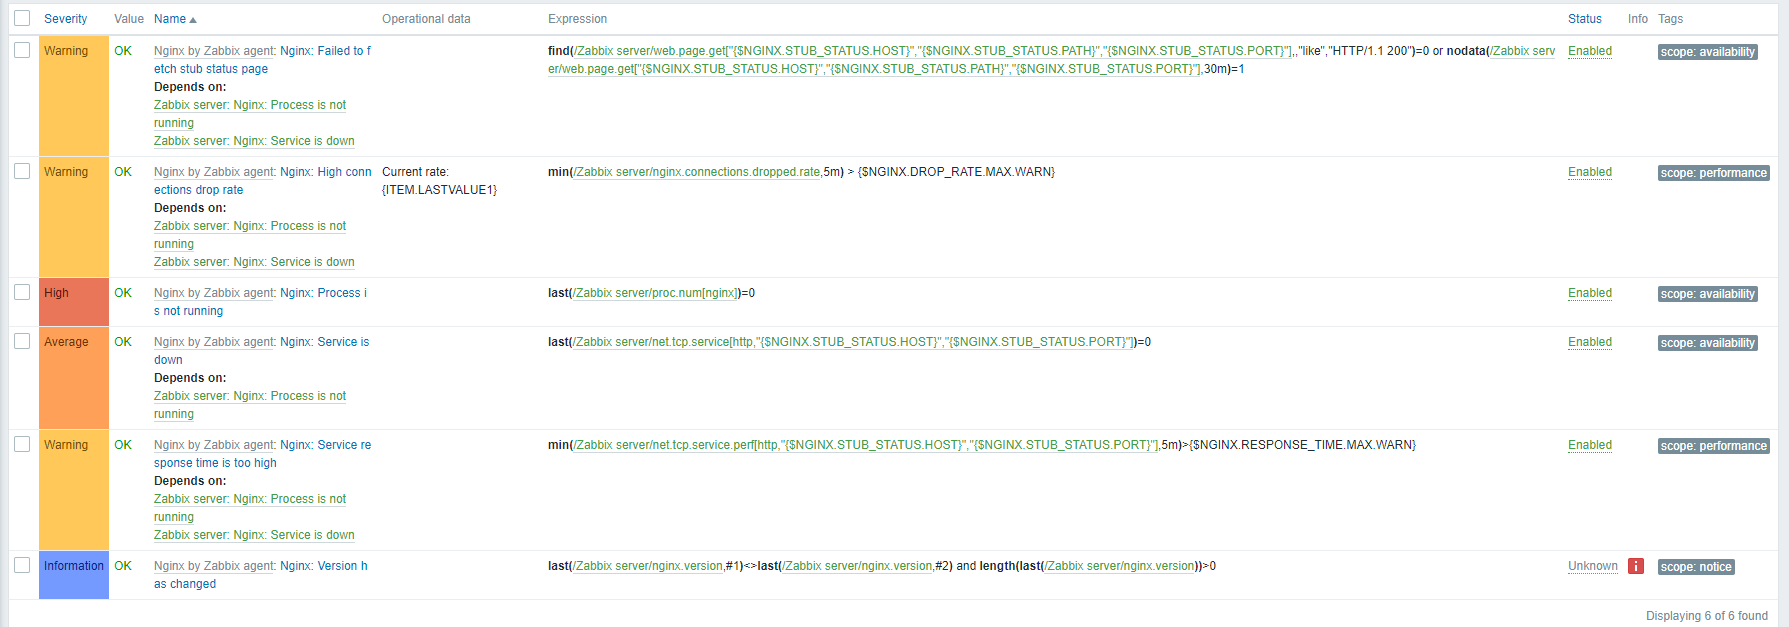
The Zabbix template also includes a number of triggers alerting you when there is a problem with your Nginx server. These triggers notify you of problems such as high CPU usage, high memory usage, high error rate, and downtime.
For example:
- High CPU usage trigger: This trigger will alert you when the CPU usage on your Nginx server exceeds a certain threshold.
- High memory usage trigger: This trigger will alert you when the memory usage on your Nginx server exceeds a certain threshold.
- High error rate trigger: This trigger will alert you when the error rate on your Nginx server exceeds a certain threshold.
- Downtime trigger: This trigger will alert you if your Nginx server stops working.
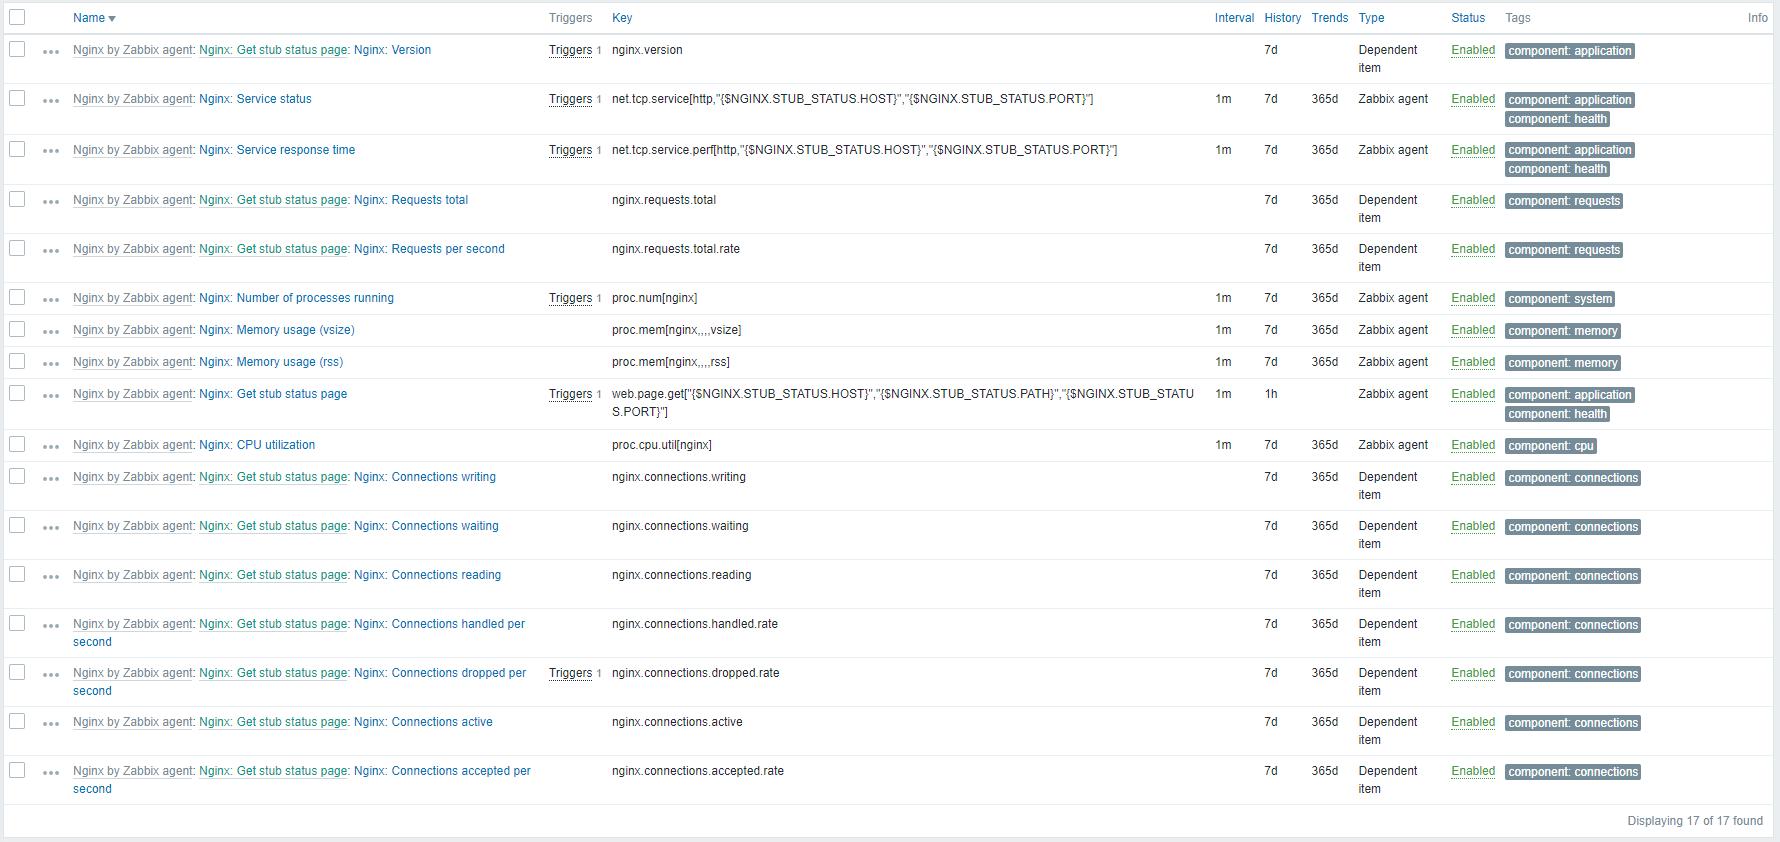
And some items if you want to check something not covered in default graphs or triggers.
Conclusion
By completing this guide, your Nginx server is now fully equipped for monitoring via Zabbix, with an appropriate template configured to capture key performance metrics. This setup enables you to actively observe server behavior, identify potential issues before they escalate, and respond swiftly—ensuring consistent uptime and smooth operation of your applications. With these monitoring capabilities in place, managing Nginx becomes more efficient, giving you full visibility into performance and helping prevent unexpected disruptions.
FAQ
- 1. How do I check if the Nginx status page is working?
After configuring /basic_status, you can test it locally with:curl http://127.0.0.1/basic_statusIf the page returns statistics, your configuration is correct.
- 2. What should I do if Zabbix doesn’t receive Nginx metrics?
Make sure the Zabbix agent is installed and running on the Nginx server.
Verify that the /basic_status page is accessible from the server itself.
Ensure that the correct template (Nginx by Zabbix agent) is assigned to the host in Zabbix. - 3. How can I monitor SSL metrics in Nginx?
The Zabbix template collects SSL-related information such as handshakes per second, supported ciphers, and certificate errors. You can find these metrics in the template’s items and use triggers to get alerts. - 4. What triggers should I pay attention to?
High CPU usage; High memory usage; High error rate; Downtime
These triggers allow you to act before issues affect users. - 5. Can I customize what Zabbix monitors on Nginx?
Yes. In addition to default items, you can create custom items or graphs for specific metrics like request times, active connections, or error types that are important to your application. - 6. How do I restart Nginx safely after making changes?
Use the following commands to test and apply configuration changes:nginx -t # Test configurationsystemctl restart nginxsystemctl status nginx


