What is Prometheus?
Prometheus is an open source project responsible for monitoring and alerting. The project was released in 2015.
Prometheus has a number of features:
- Supports flexible query languages;
- Has several display modes and admin panel;
- Data is stored and transmitted via the HTTP protocol.
This guide explains how to install Prometheus on Ubuntu 20.04 for server monitoring and alerting. You will learn how to download Prometheus, configure it as a systemd service, secure access with a firewall, and access the web interface. The instructions are suitable for VPS, cloud servers, and dedicated Linux environments.
Installing Prometheus
Before installing Prometheus, make sure your Ubuntu 20.04 server has root or sudo access and an active internet connection. All commands below are executed as the root user or via sudo.
To install Prometheus, you need to update all the packages on your system, use the commands below to update them.
sudo apt update && sudo apt upgrade -y

Installing the Nginx web server
Nginx is available from Ubuntu's open source resources. The installation starts with the following commands:
apt install nginx
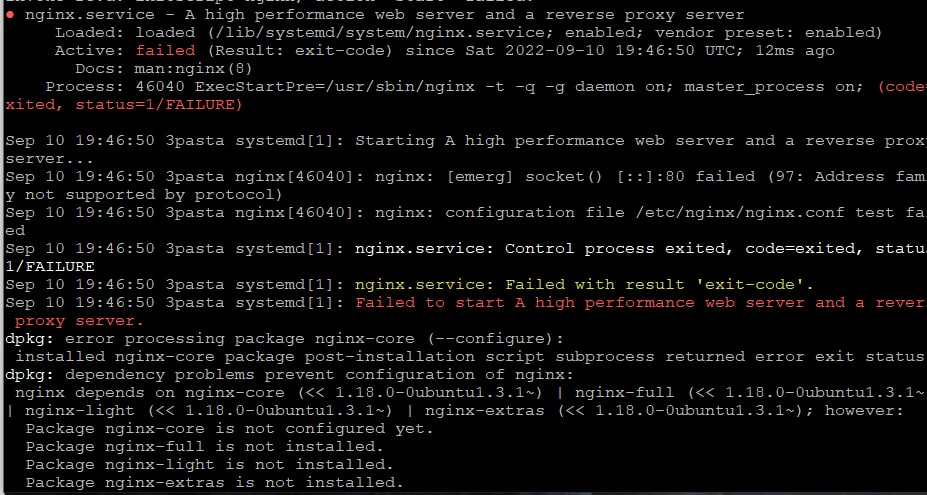
If you get this error:

You should write the following commands:
rm /etc/nginx/sites-enabled/default

service nginx restart
and continue through the above steps.
The last commands in this section will be executed afterwards so that the nginx webserver runs automatically when we start it up.
systemctl enable nginx.serviceCreating a user in Prometheus
First we start by creating a group, then we create a user and add him to the group. We also need to create a directory.
First, we create a group for the user
groupadd prometheus![]()
Then, we create the user himself:
useradd -s /sbin/nologin --system -g prometheus prometheus![]()
Create a directory:
mkdir /var/lib/prometheus![]()
for i in rules rules.d files_sd; do sudo mkdir -p /etc/prometheus/${i}; done![]()
Now we install Prometheus on Ubuntu
Before further configuration, I recommend checking if you have CURL installed, if not, then type the following command and go on:
apt install curlDownload the latest version of Prometheus with the WGET command:
mkdir -p /tmp/prometheus

cd /tmp/prometheus

curl -s https://api.github.com/repos/prometheus/prometheus/releases/latest | grep browser_download_url | grep linux-amd64 | cut -d '"' -f 4 | wget -qi -

tar xvf prometheus*.tar.gz
Go to the resulting directory.
For example:
cd /tmp/prometheus/prometheus-2.46.0.linux-amd64Afterwards we move the Prometheus and Promtool files from the Prometheus folder to /usr/local/bin
mv prometheus promtool /usr/local/bin/Setting up Prometheus
The first thing to do is to create a configuration file named "Prometheus.yml" in this /etc/prometheus directory
mv prometheus.yml /etc/prometheus/prometheus.yml

mv consoles/ console_libraries/ /etc/prometheus/

nano /etc/prometheus/prometheus.yml
Look at the content of prometheus.yml and if it has data then let's move on.
Creating a Prometheus systemd Service on Ubuntu 20.04
For the sake of simplicity, we create the files for the systemd service:
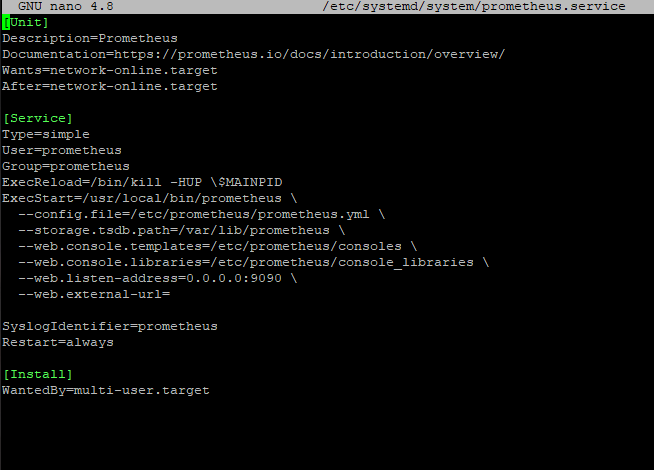
nano /etc/systemd/system/prometheus.serviceAdd this text to this file:
[Unit]

Description=Prometheus

Documentation=https://prometheus.io/docs/introduction/overview/

Wants=network-online.target

After=network-online.target
[Service]

Type=simple

User=prometheus

Group=prometheus

ExecReload=/bin/kill -HUP \$MAINPID

ExecStart=/usr/local/bin/prometheus \

--config.file=/etc/prometheus/prometheus.yml \

--storage.tsdb.path=/var/lib/prometheus \

--web.console.templates=/etc/prometheus/consoles \

--web.console.libraries=/etc/prometheus/console_libraries \

--web.listen-address=0.0.0.0:9090 \

--web.external-url=
SyslogIdentifier=prometheus

Restart=always
[Install]

WantedBy=multi-user.target
Bottom line after these commands:

And finally, change the owner of these directories to the previously created user and Prometheus group:
for i in rules rules.d files_sd; do sudo chown -R prometheus:prometheus /etc/prometheus/${i}; done

for i in rules rules.d files_sd; do sudo chmod -R 775 /etc/prometheus/${i}; done

chown -R prometheus:prometheus /var/lib/prometheus/
Once you have spelled and checked everything out, reboot systemd:
systemctl daemon-reload

systemctl enable prometheus
Configuring the Firewall for Prometheus on Ubuntu
To allow external access to Prometheus and the Nginx web server, you need to open the required ports in UFW.
Now we have to make sure the firewall is configured correctly and allows traffic on ports HTTPS(443), HTTP(80) and 9090. The Nginx webserver represents itself as a ufw service:
ufw allow in "Nginx Full"

ufw allow 9090/tcp
Access to the Prometheus web interface.
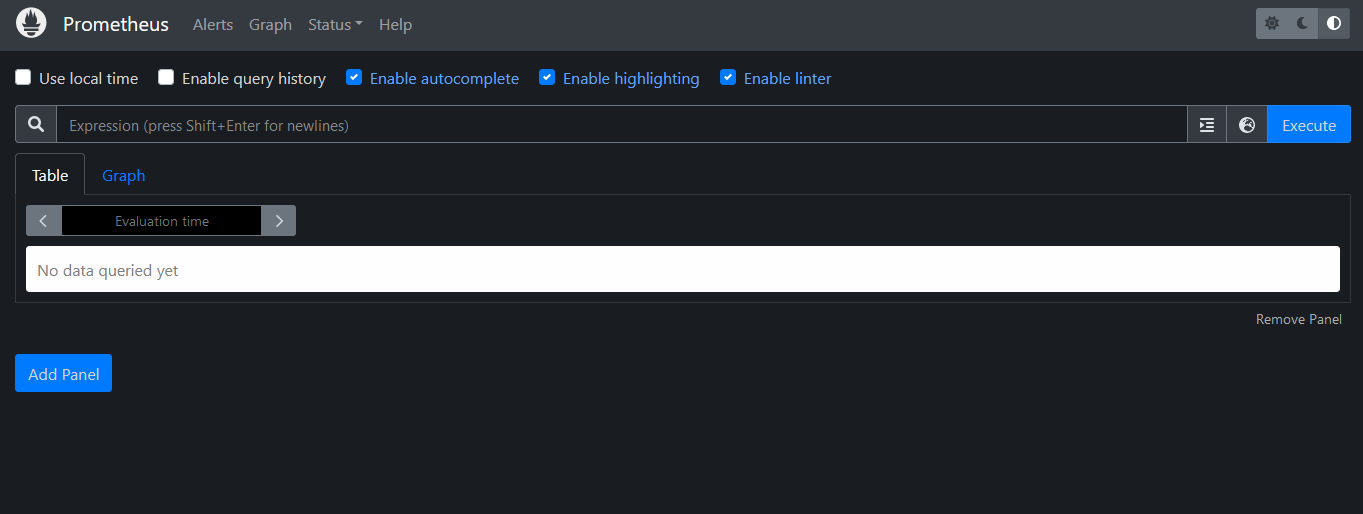
By standard Prometheus is available on HTTP port 9090. To check this, you open our browser, and in the address bar write either the ip-address of the host where you have installed Prometheus, or the domain. And if everything is set correctly, then you will open the Prometheus dashboard tab.
http://your-domain.com:9090 (example http://domain:9090)
http://server-ip-addreess:9090 (example http://38.123.34.54:9090)

Conclusion
This guide showed how to install and configure Prometheus on Ubuntu 20.04, including user setup, systemd integration, firewall rules, and web interface access. Prometheus can now be used to monitor server metrics, applications, and infrastructure components in production or test environments.


