
Description
Suricata is a high-performance, open-source network threat detection engine used for intrusion detection (IDS), intrusion prevention (IPS), and network security monitoring (NSM).
It operates based on a flexible set of predefined or custom user rules. These rules determine how network traffic is inspected, logged, analyzed, and — if configured — even modified in real time.
Suricata has some “out-of-the-box” predefined rules, which could be called "passive mode" cause system just warns an administrator without any traffic changes.
It is possible to run this software on the office's gateway to “passthrough” all traffic or run onto all hosts independantly.

Before the start
Optimal hardware requirements is relative to the the LAN topology and depends of your needs. Moustly, a lot of inspected traffic needs much resources should be assigned to Suricata. In common cases at least 2 CPU cores and 4 or 8 GygaBytes of RAM is needed.
So, requirements is:
Ubuntu 20.04, on the server notless then 4Gb RAM and 2 CPU cores, permissions to do something as root or sudo-group member, system firewall enabled.
Installation process
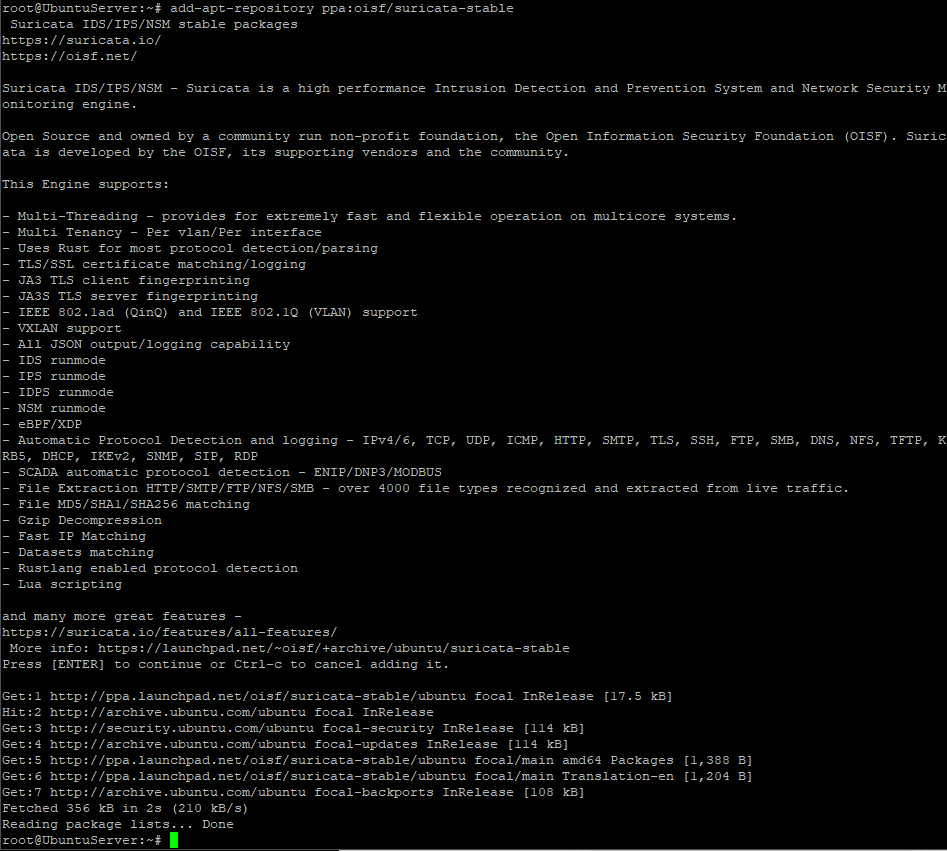
- Firstly, you need to add 3rd-party repo into the operation system. Just authorize as superuser and execute:
add-apt-repository ppa:oisf/suricata-stableConfirm if security warning appears
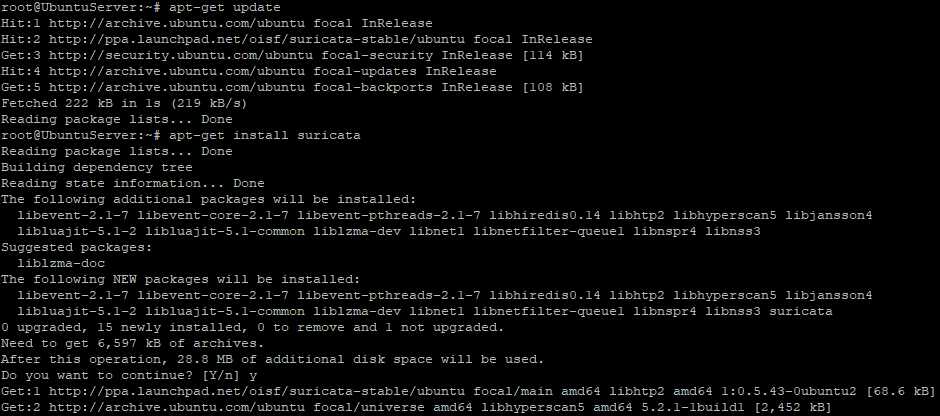
- Install maintainer's pre-built tool:
apt-get update

apt-get install suricata
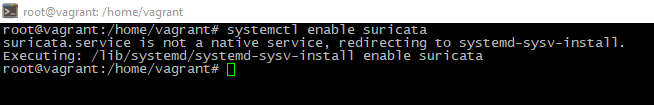
- Then add new service to the autostart pool. If you've seen console output like this - startup turned on successfully:
systemctl enable suricata
One-time configuration
The Suricata utility is "covers" needs of majority users "out-of-the-box". It is working in "safe" mode, so no network packets drops, only warns. This practice is good until you dont have "deep knoweledges" in this topic.
But even default preset probably has some useful options, e.g. community flow ID
It could be useful in case needs of integrate another complexes (Elasticsearch for example) with Suricata. Community ID could be inserted into Suricata config. Just edit "community-id:" directive, set its value to "true" in /etc/suricata/suricata.yaml config.
cd /etc/suricata/suricata.yaml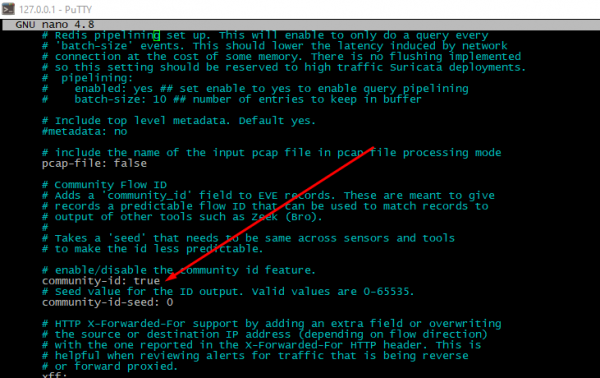
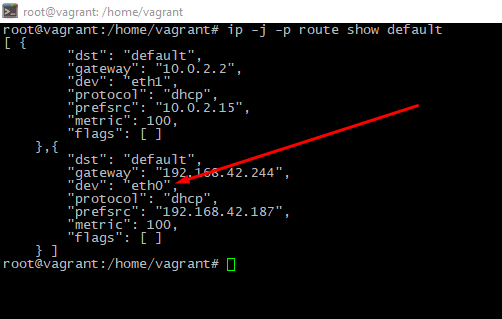
Define which network interface should we monitoring. To find network adapter with default interface you should run command like this:
ip -j -p route show defaultA little description: -j option will set "output" format as JSON, -p flag will improove readability. The "main" is shown adapter is into "dev" row.
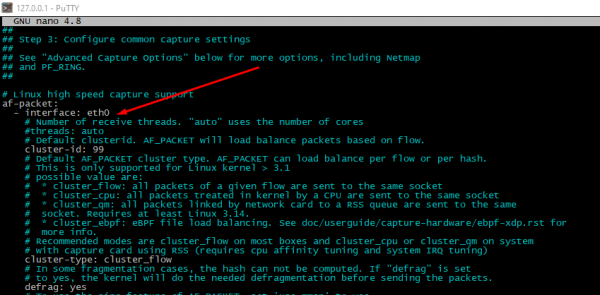
To check and change an interface name please open file /etc/suricata/suricata.yaml, look for "interface" directive around the row #550. If there are multiple interfaces presented, possible to add it into the config file too.
Finally, you must re-run the service. Do
service suricata restartRulesets updating
To get additional rules suricata-update tool should be used. Utility can get traffic rules from a resources of non-commercial or paid providers. Also it could show sets system uses now.
suricata-update list-sourcesThis tool is designed to manage rulesets, enable or disable it. E.g. to install new ruleset, please execute:
suricata-update enable-source <RULESET_NAME>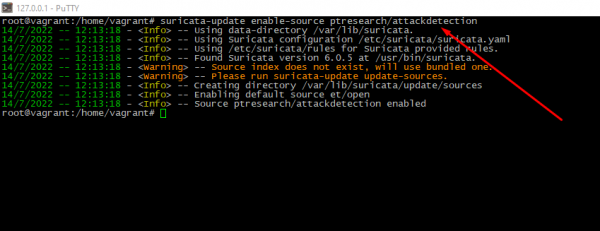
Run suricata-update again to apply changes.
Checking the current settings
Good practice is checking configuration after each modify. Just execute:
suricata -T -v -c /etc/suricata/suricata.yaml # -T option is forces Suricata to work in "checking" mode, -c will set path to config file, -v option needs to print more information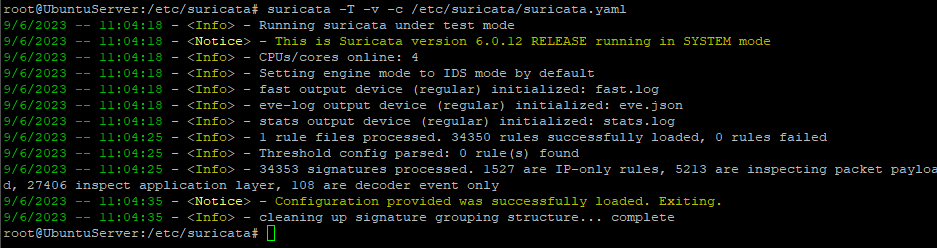
Service's launching
To restart the daemon after successful config check please execute:
service suricata restartThen look, is service really started or not
service suricata status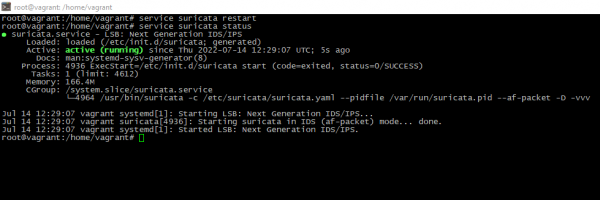
Testing actual rules
To check is rules really relevant to expectations or not, just install jq tool to do log more understandable and get especially file:
apt-get install jqapt-get install curlcurl http://testmynids.org/uid/index.html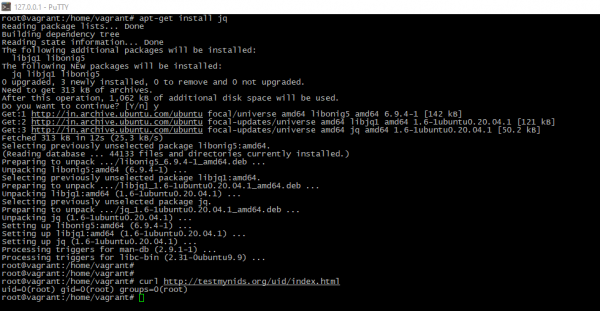
To look for alerts please do:
tail -f /var/log/suricata/fast.log

tail -f /var/log/suricata/eve.log
You will see "filterd" output from the logs sorted by alert ID:
jq 'select(.alert .signature_id==<ALERT_ID>)' /var/log/suricata/eve.json 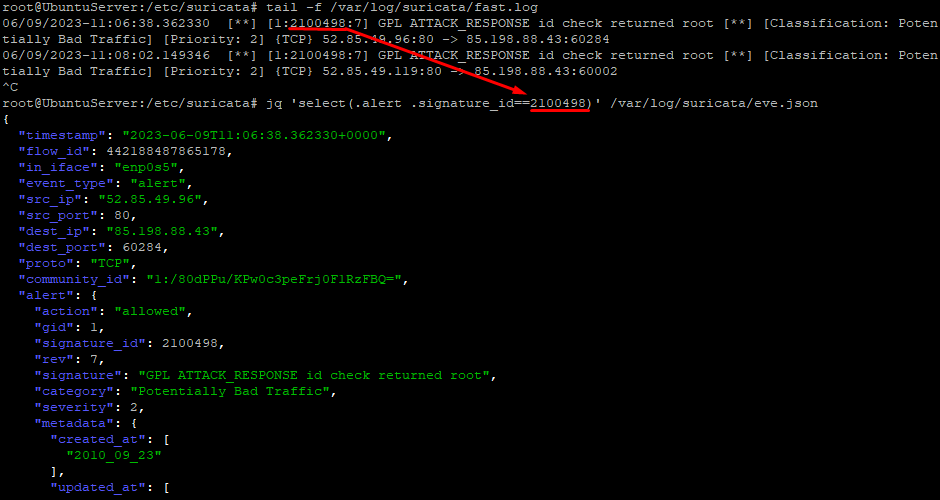
At the end
Today, you have successfully installed and configured the Suricata network security tool on Ubuntu.
You’ve learned how to generate and use the Community Flow ID, which allows Suricata to be integrated with other tools like Elasticsearch, Kibana, or Zeek for enhanced traffic analysis and incident response.
Additionally, we explored how to inspect and adjust Suricata’s configuration settings, and tested its ability to detect and log HTTP traffic in real time.


